Dominican vs West Indian Male Unemployment
COMPARE
Dominican
West Indian
Male Unemployment
Male Unemployment Comparison
Dominicans
West Indians
7.6%
MALE UNEMPLOYMENT
0.0/ 100
METRIC RATING
324th/ 347
METRIC RANK
6.7%
MALE UNEMPLOYMENT
0.0/ 100
METRIC RATING
304th/ 347
METRIC RANK
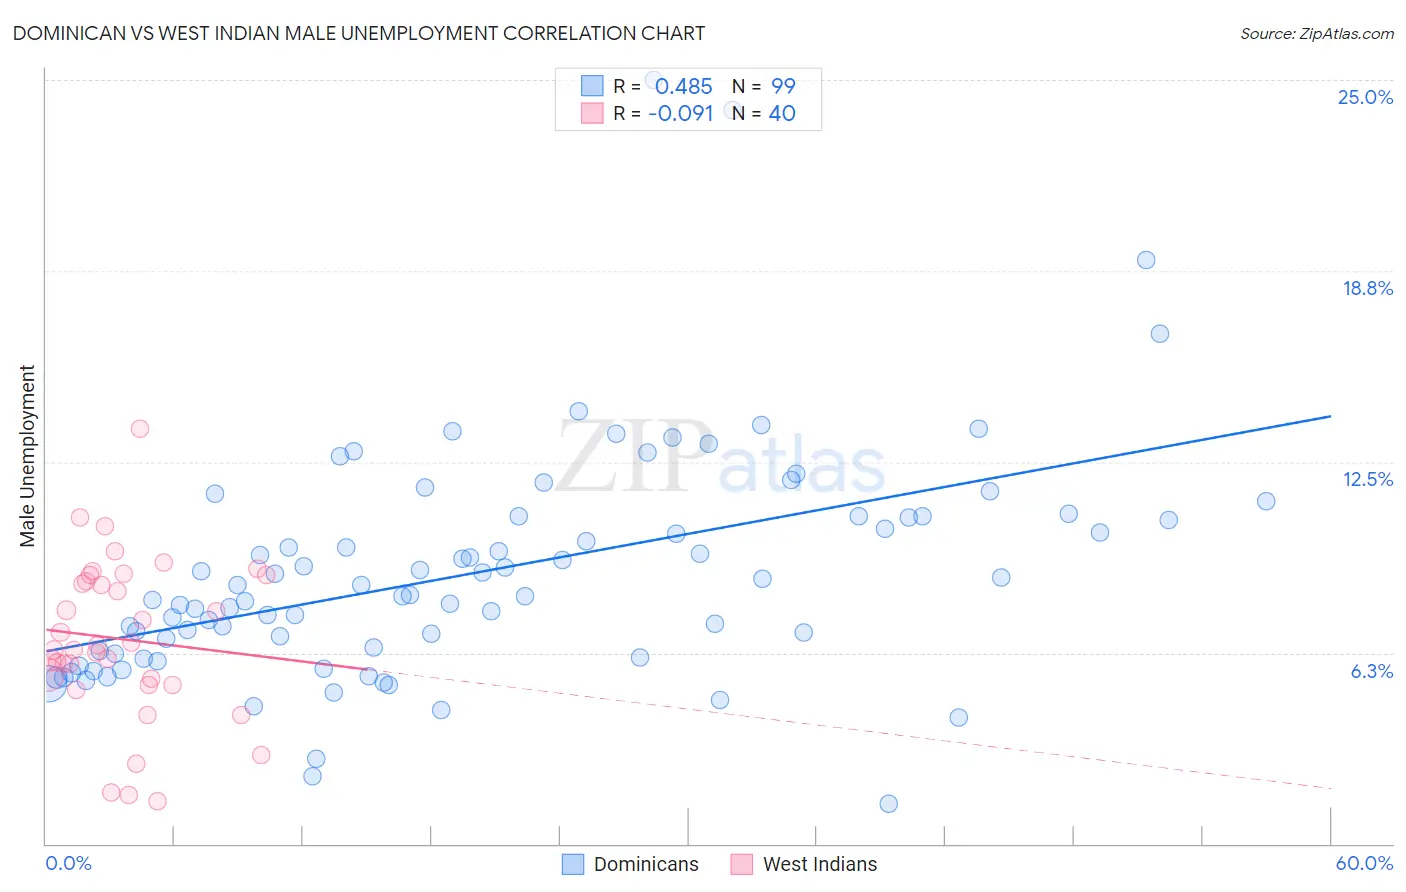
Dominican vs West Indian Male Unemployment Correlation Chart
The statistical analysis conducted on geographies consisting of 353,678,027 people shows a moderate positive correlation between the proportion of Dominicans and unemployment rate among males in the United States with a correlation coefficient (R) of 0.485 and weighted average of 7.6%. Similarly, the statistical analysis conducted on geographies consisting of 253,602,585 people shows a slight negative correlation between the proportion of West Indians and unemployment rate among males in the United States with a correlation coefficient (R) of -0.091 and weighted average of 6.7%, a difference of 13.7%.
Male Unemployment Correlation Summary
| Measurement | Dominican | West Indian |
| Minimum | 1.3% | 1.4% |
| Maximum | 25.0% | 13.6% |
| Range | 23.7% | 12.2% |
| Mean | 8.9% | 6.7% |
| Median | 8.1% | 6.4% |
| Interquartile 25% (IQ1) | 6.2% | 5.3% |
| Interquartile 75% (IQ3) | 10.7% | 8.7% |
| Interquartile Range (IQR) | 4.5% | 3.4% |
| Standard Deviation (Sample) | 3.8% | 2.6% |
| Standard Deviation (Population) | 3.8% | 2.6% |
Demographics Similar to Dominicans and West Indians by Male Unemployment
In terms of male unemployment, the demographic groups most similar to Dominicans are Immigrants from Grenada (7.6%, a difference of 0.27%), Immigrants from Cabo Verde (7.5%, a difference of 1.1%), Immigrants from St. Vincent and the Grenadines (7.5%, a difference of 1.4%), Colville (7.4%, a difference of 2.8%), and British West Indian (7.3%, a difference of 3.7%). Similarly, the demographic groups most similar to West Indians are Trinidadian and Tobagonian (6.7%, a difference of 0.32%), Immigrants from Trinidad and Tobago (6.7%, a difference of 0.52%), Immigrants from Jamaica (6.7%, a difference of 0.60%), Aleut (6.8%, a difference of 2.5%), and Barbadian (6.9%, a difference of 2.9%).
| Demographics | Rating | Rank | Male Unemployment |
| West Indians | 0.0 /100 | #304 | Tragic 6.7% |
| Trinidadians and Tobagonians | 0.0 /100 | #305 | Tragic 6.7% |
| Immigrants | Trinidad and Tobago | 0.0 /100 | #306 | Tragic 6.7% |
| Immigrants | Jamaica | 0.0 /100 | #307 | Tragic 6.7% |
| Aleuts | 0.0 /100 | #308 | Tragic 6.8% |
| Barbadians | 0.0 /100 | #309 | Tragic 6.9% |
| Blacks/African Americans | 0.0 /100 | #310 | Tragic 6.9% |
| Immigrants | Armenia | 0.0 /100 | #311 | Tragic 6.9% |
| Lumbee | 0.0 /100 | #312 | Tragic 6.9% |
| Immigrants | Dominica | 0.0 /100 | #313 | Tragic 7.0% |
| Immigrants | Barbados | 0.0 /100 | #314 | Tragic 7.1% |
| Houma | 0.0 /100 | #315 | Tragic 7.1% |
| Immigrants | Guyana | 0.0 /100 | #316 | Tragic 7.1% |
| Guyanese | 0.0 /100 | #317 | Tragic 7.1% |
| Cape Verdeans | 0.0 /100 | #318 | Tragic 7.1% |
| British West Indians | 0.0 /100 | #319 | Tragic 7.3% |
| Colville | 0.0 /100 | #320 | Tragic 7.4% |
| Immigrants | St. Vincent and the Grenadines | 0.0 /100 | #321 | Tragic 7.5% |
| Immigrants | Cabo Verde | 0.0 /100 | #322 | Tragic 7.5% |
| Immigrants | Grenada | 0.0 /100 | #323 | Tragic 7.6% |
| Dominicans | 0.0 /100 | #324 | Tragic 7.6% |