Apache vs Immigrants from Colombia Male Unemployment
COMPARE
Apache
Immigrants from Colombia
Male Unemployment
Male Unemployment Comparison
Apache
Immigrants from Colombia
8.6%
MALE UNEMPLOYMENT
0.0/ 100
METRIC RATING
338th/ 347
METRIC RANK
5.1%
MALE UNEMPLOYMENT
86.8/ 100
METRIC RATING
126th/ 347
METRIC RANK
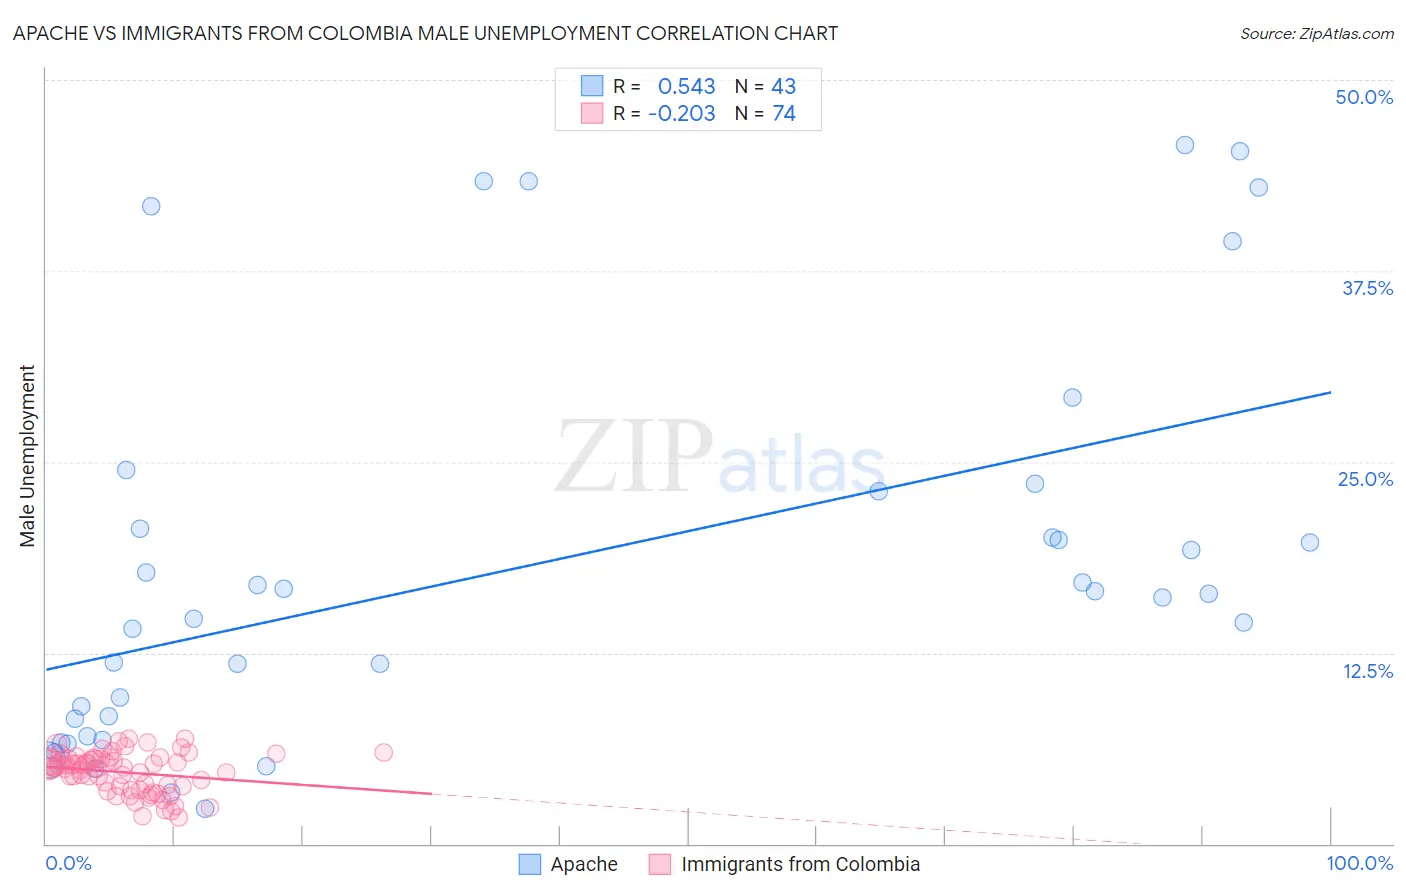
Apache vs Immigrants from Colombia Male Unemployment Correlation Chart
The statistical analysis conducted on geographies consisting of 230,425,231 people shows a substantial positive correlation between the proportion of Apache and unemployment rate among males in the United States with a correlation coefficient (R) of 0.543 and weighted average of 8.6%. Similarly, the statistical analysis conducted on geographies consisting of 377,439,396 people shows a weak negative correlation between the proportion of Immigrants from Colombia and unemployment rate among males in the United States with a correlation coefficient (R) of -0.203 and weighted average of 5.1%, a difference of 67.1%.
Male Unemployment Correlation Summary
| Measurement | Apache | Immigrants from Colombia |
| Minimum | 2.3% | 1.7% |
| Maximum | 45.7% | 6.9% |
| Range | 43.4% | 5.2% |
| Mean | 18.3% | 4.7% |
| Median | 16.4% | 5.0% |
| Interquartile 25% (IQ1) | 8.2% | 3.8% |
| Interquartile 75% (IQ3) | 23.1% | 5.5% |
| Interquartile Range (IQR) | 14.9% | 1.8% |
| Standard Deviation (Sample) | 12.7% | 1.3% |
| Standard Deviation (Population) | 12.6% | 1.3% |
Similar Demographics by Male Unemployment
Demographics Similar to Apache by Male Unemployment
In terms of male unemployment, the demographic groups most similar to Apache are Puerto Rican (8.6%, a difference of 0.15%), Yuman (8.6%, a difference of 0.23%), Pueblo (8.5%, a difference of 1.6%), Tsimshian (8.5%, a difference of 1.7%), and Sioux (8.4%, a difference of 2.6%).
| Demographics | Rating | Rank | Male Unemployment |
| Alaska Natives | 0.0 /100 | #331 | Tragic 8.1% |
| Pima | 0.0 /100 | #332 | Tragic 8.3% |
| Sioux | 0.0 /100 | #333 | Tragic 8.4% |
| Tsimshian | 0.0 /100 | #334 | Tragic 8.5% |
| Pueblo | 0.0 /100 | #335 | Tragic 8.5% |
| Yuman | 0.0 /100 | #336 | Tragic 8.6% |
| Puerto Ricans | 0.0 /100 | #337 | Tragic 8.6% |
| Apache | 0.0 /100 | #338 | Tragic 8.6% |
| Cheyenne | 0.0 /100 | #339 | Tragic 9.8% |
| Alaskan Athabascans | 0.0 /100 | #340 | Tragic 9.8% |
| Navajo | 0.0 /100 | #341 | Tragic 9.8% |
| Tohono O'odham | 0.0 /100 | #342 | Tragic 10.2% |
| Crow | 0.0 /100 | #343 | Tragic 10.6% |
| Hopi | 0.0 /100 | #344 | Tragic 10.8% |
| Arapaho | 0.0 /100 | #345 | Tragic 11.0% |
Demographics Similar to Immigrants from Colombia by Male Unemployment
In terms of male unemployment, the demographic groups most similar to Immigrants from Colombia are Immigrants from Lithuania (5.1%, a difference of 0.060%), Immigrants from Brazil (5.2%, a difference of 0.060%), Immigrants from Latvia (5.1%, a difference of 0.10%), Palestinian (5.1%, a difference of 0.12%), and Nicaraguan (5.1%, a difference of 0.19%).
| Demographics | Rating | Rank | Male Unemployment |
| French Canadians | 88.6 /100 | #119 | Excellent 5.1% |
| Ukrainians | 88.4 /100 | #120 | Excellent 5.1% |
| Mongolians | 88.4 /100 | #121 | Excellent 5.1% |
| Nicaraguans | 88.2 /100 | #122 | Excellent 5.1% |
| Palestinians | 87.7 /100 | #123 | Excellent 5.1% |
| Immigrants | Latvia | 87.5 /100 | #124 | Excellent 5.1% |
| Immigrants | Lithuania | 87.2 /100 | #125 | Excellent 5.1% |
| Immigrants | Colombia | 86.8 /100 | #126 | Excellent 5.1% |
| Immigrants | Brazil | 86.3 /100 | #127 | Excellent 5.2% |
| Hungarians | 85.1 /100 | #128 | Excellent 5.2% |
| Immigrants | Western Europe | 84.8 /100 | #129 | Excellent 5.2% |
| Immigrants | Malaysia | 83.5 /100 | #130 | Excellent 5.2% |
| Immigrants | Germany | 83.0 /100 | #131 | Excellent 5.2% |
| Chickasaw | 82.9 /100 | #132 | Excellent 5.2% |
| Colombians | 81.1 /100 | #133 | Excellent 5.2% |