Apache vs Immigrants from Kazakhstan Male Unemployment
COMPARE
Apache
Immigrants from Kazakhstan
Male Unemployment
Male Unemployment Comparison
Apache
Immigrants from Kazakhstan
8.6%
MALE UNEMPLOYMENT
0.0/ 100
METRIC RATING
338th/ 347
METRIC RANK
5.3%
MALE UNEMPLOYMENT
50.8/ 100
METRIC RATING
172nd/ 347
METRIC RANK
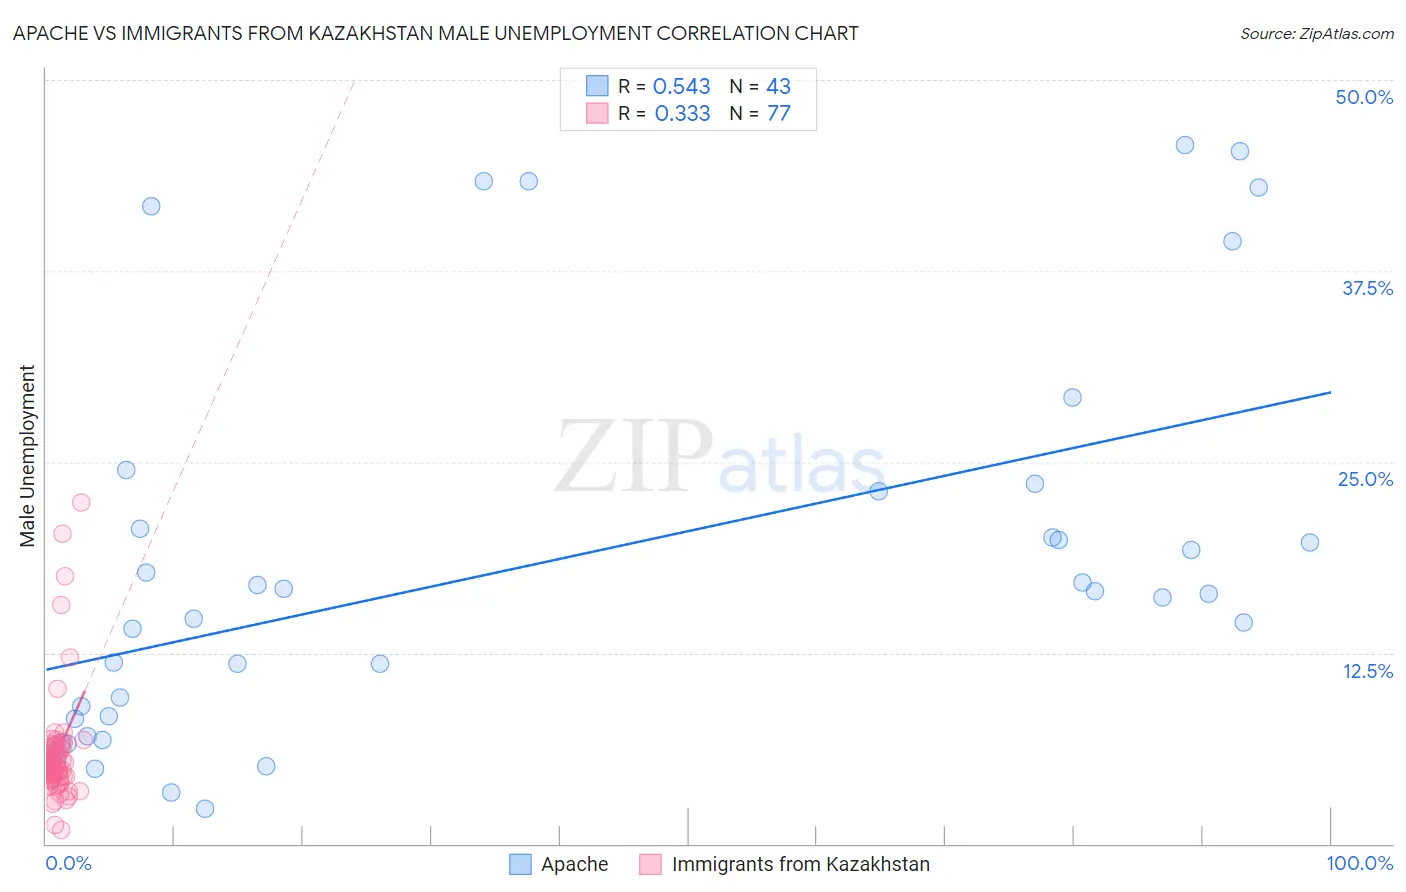
Apache vs Immigrants from Kazakhstan Male Unemployment Correlation Chart
The statistical analysis conducted on geographies consisting of 230,425,231 people shows a substantial positive correlation between the proportion of Apache and unemployment rate among males in the United States with a correlation coefficient (R) of 0.543 and weighted average of 8.6%. Similarly, the statistical analysis conducted on geographies consisting of 124,296,316 people shows a mild positive correlation between the proportion of Immigrants from Kazakhstan and unemployment rate among males in the United States with a correlation coefficient (R) of 0.333 and weighted average of 5.3%, a difference of 62.6%.
Male Unemployment Correlation Summary
| Measurement | Apache | Immigrants from Kazakhstan |
| Minimum | 2.3% | 0.90% |
| Maximum | 45.7% | 22.3% |
| Range | 43.4% | 21.4% |
| Mean | 18.3% | 5.8% |
| Median | 16.4% | 5.1% |
| Interquartile 25% (IQ1) | 8.2% | 4.4% |
| Interquartile 75% (IQ3) | 23.1% | 6.2% |
| Interquartile Range (IQR) | 14.9% | 1.8% |
| Standard Deviation (Sample) | 12.7% | 3.5% |
| Standard Deviation (Population) | 12.6% | 3.5% |
Similar Demographics by Male Unemployment
Demographics Similar to Apache by Male Unemployment
In terms of male unemployment, the demographic groups most similar to Apache are Puerto Rican (8.6%, a difference of 0.15%), Yuman (8.6%, a difference of 0.23%), Pueblo (8.5%, a difference of 1.6%), Tsimshian (8.5%, a difference of 1.7%), and Sioux (8.4%, a difference of 2.6%).
| Demographics | Rating | Rank | Male Unemployment |
| Alaska Natives | 0.0 /100 | #331 | Tragic 8.1% |
| Pima | 0.0 /100 | #332 | Tragic 8.3% |
| Sioux | 0.0 /100 | #333 | Tragic 8.4% |
| Tsimshian | 0.0 /100 | #334 | Tragic 8.5% |
| Pueblo | 0.0 /100 | #335 | Tragic 8.5% |
| Yuman | 0.0 /100 | #336 | Tragic 8.6% |
| Puerto Ricans | 0.0 /100 | #337 | Tragic 8.6% |
| Apache | 0.0 /100 | #338 | Tragic 8.6% |
| Cheyenne | 0.0 /100 | #339 | Tragic 9.8% |
| Alaskan Athabascans | 0.0 /100 | #340 | Tragic 9.8% |
| Navajo | 0.0 /100 | #341 | Tragic 9.8% |
| Tohono O'odham | 0.0 /100 | #342 | Tragic 10.2% |
| Crow | 0.0 /100 | #343 | Tragic 10.6% |
| Hopi | 0.0 /100 | #344 | Tragic 10.8% |
| Arapaho | 0.0 /100 | #345 | Tragic 11.0% |
Demographics Similar to Immigrants from Kazakhstan by Male Unemployment
In terms of male unemployment, the demographic groups most similar to Immigrants from Kazakhstan are Immigrants from Russia (5.3%, a difference of 0.010%), Immigrants from Iran (5.3%, a difference of 0.050%), Peruvian (5.3%, a difference of 0.060%), Immigrants from Iraq (5.3%, a difference of 0.16%), and Immigrants from Eastern Europe (5.3%, a difference of 0.19%).
| Demographics | Rating | Rank | Male Unemployment |
| South Americans | 60.6 /100 | #165 | Good 5.3% |
| Immigrants | Morocco | 60.2 /100 | #166 | Good 5.3% |
| Immigrants | Vietnam | 58.1 /100 | #167 | Average 5.3% |
| Immigrants | Ireland | 57.7 /100 | #168 | Average 5.3% |
| Immigrants | Congo | 57.4 /100 | #169 | Average 5.3% |
| Immigrants | Eastern Europe | 54.1 /100 | #170 | Average 5.3% |
| Peruvians | 51.9 /100 | #171 | Average 5.3% |
| Immigrants | Kazakhstan | 50.8 /100 | #172 | Average 5.3% |
| Immigrants | Russia | 50.7 /100 | #173 | Average 5.3% |
| Immigrants | Iran | 50.0 /100 | #174 | Average 5.3% |
| Immigrants | Iraq | 48.1 /100 | #175 | Average 5.3% |
| Immigrants | Poland | 46.0 /100 | #176 | Average 5.3% |
| Immigrants | Peru | 44.6 /100 | #177 | Average 5.3% |
| Osage | 42.5 /100 | #178 | Average 5.3% |
| Immigrants | Oceania | 40.8 /100 | #179 | Average 5.3% |