Zip Codes with the Highest Percentage of Population Employed in Farming, Fishing & Forestry in Granbury, TX
RELATED REPORTS & OPTIONS
Select to Compare
Select to Compare
Compare Zip Codes
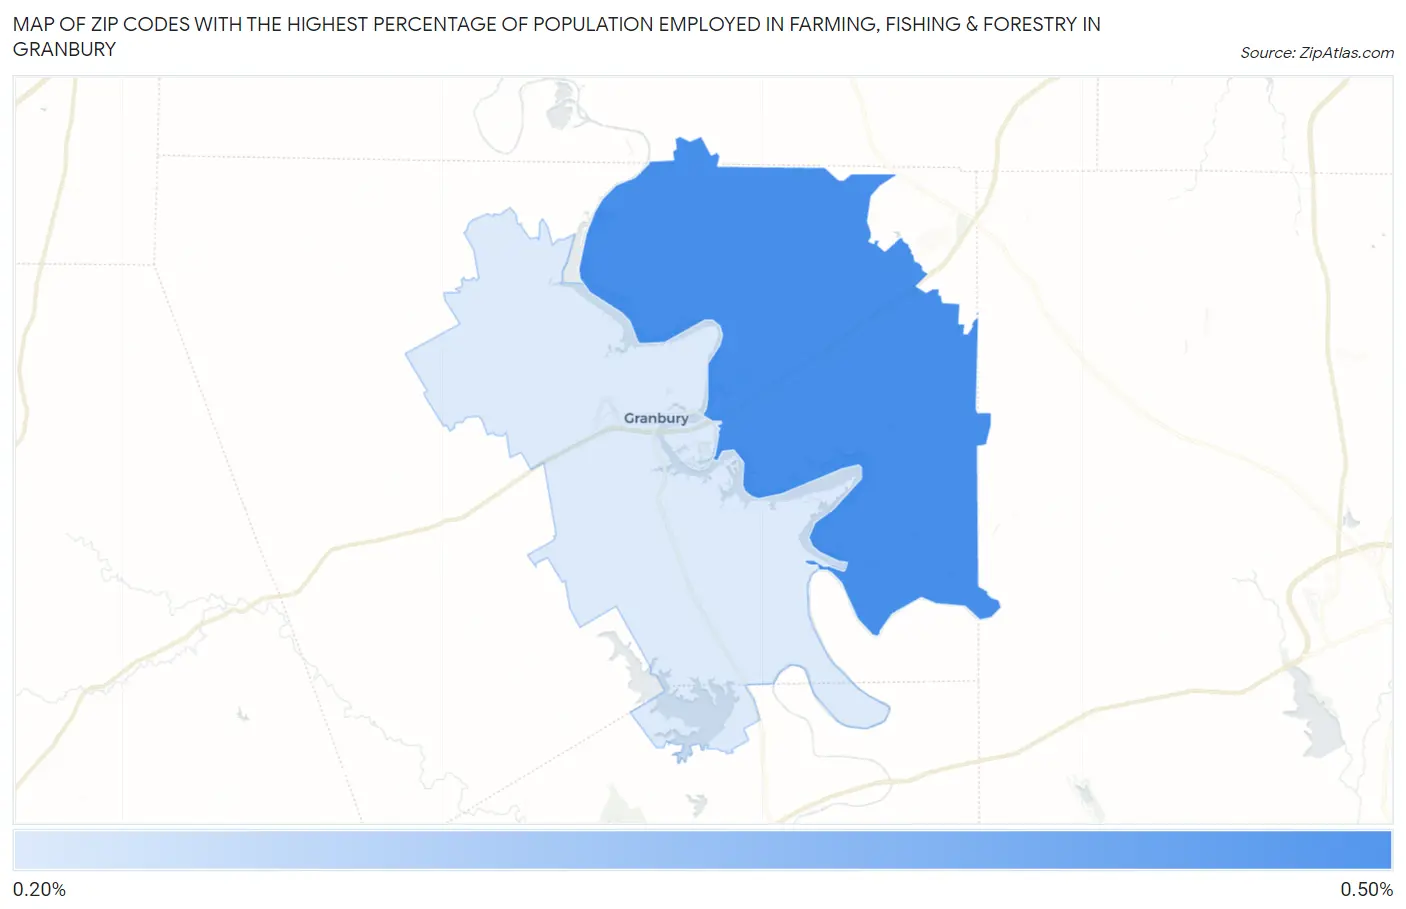
Map of Zip Codes with the Highest Percentage of Population Employed in Farming, Fishing & Forestry in Granbury
0.25%
0.25%
Zip Codes with the Highest Percentage of Population Employed in Farming, Fishing & Forestry in Granbury, TX
| Zip Code | % Employed | vs State | vs National | |
| 1. | 76048 | 0.25% | 0.37%(-0.126)#832 | 0.61%(-0.359)#15,468 |
1
Common Questions
What are the Top Zip Codes with the Highest Percentage of Population Employed in Farming, Fishing & Forestry in Granbury, TX?
Top Zip Codes with the Highest Percentage of Population Employed in Farming, Fishing & Forestry in Granbury, TX are:
What zip code has the Highest Percentage of Population Employed in Farming, Fishing & Forestry in Granbury, TX?
76048 has the Highest Percentage of Population Employed in Farming, Fishing & Forestry in Granbury, TX with 0.25%.
What is the Percentage of Population Employed in Farming, Fishing & Forestry in Texas?
Percentage of Population Employed in Farming, Fishing & Forestry in Texas is 0.37%.
What is the Percentage of Population Employed in Farming, Fishing & Forestry in the United States?
Percentage of Population Employed in Farming, Fishing & Forestry in the United States is 0.61%.