Immigrants from Lebanon vs Immigrants from Eritrea Poverty
COMPARE
Immigrants from Lebanon
Immigrants from Eritrea
Poverty
Poverty Comparison
Immigrants from Lebanon
Immigrants from Eritrea
12.8%
POVERTY
18.7/ 100
METRIC RATING
197th/ 347
METRIC RANK
13.4%
POVERTY
2.4/ 100
METRIC RATING
224th/ 347
METRIC RANK
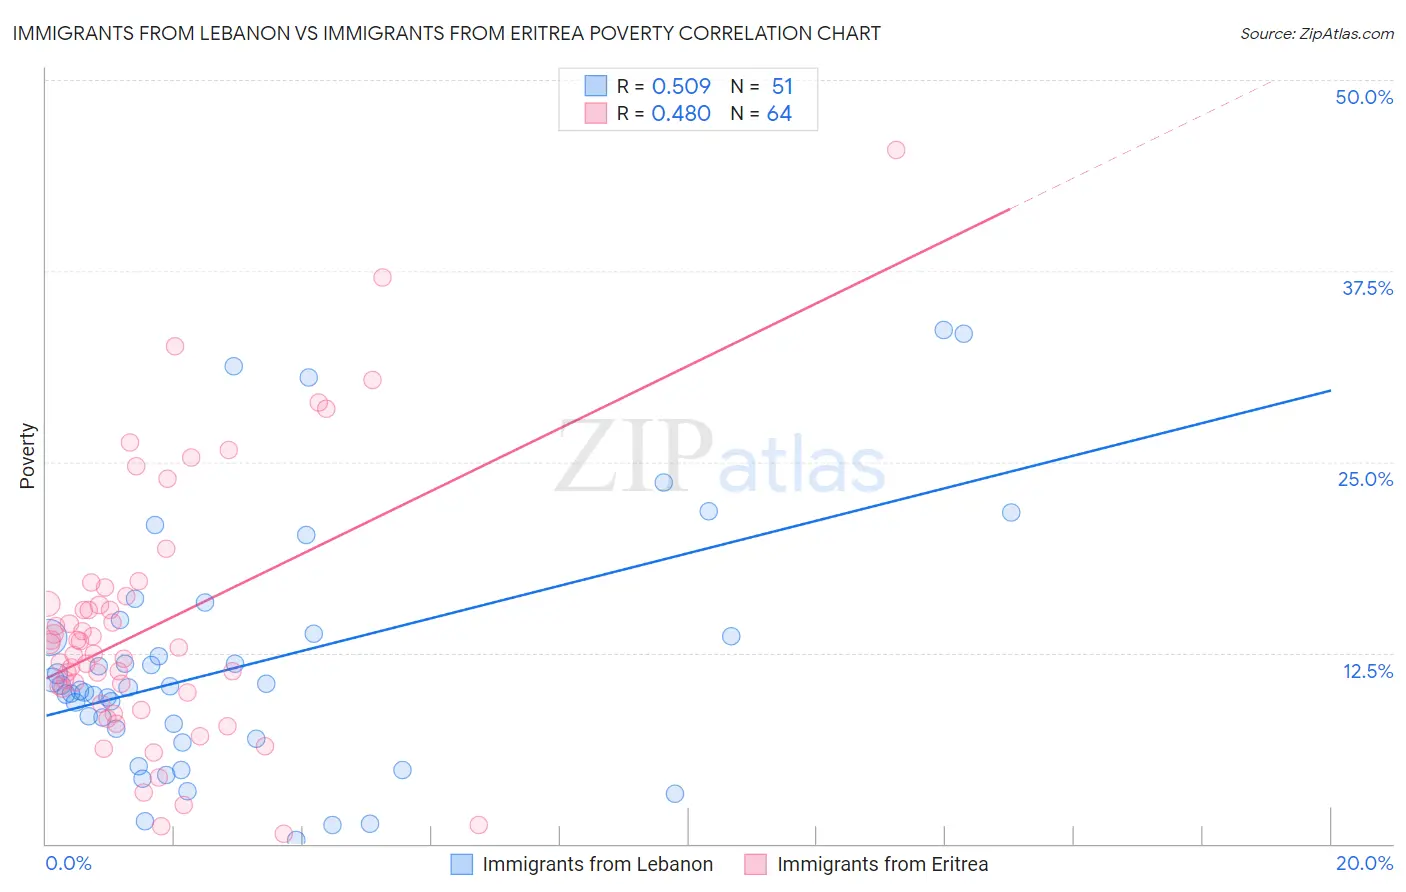
Immigrants from Lebanon vs Immigrants from Eritrea Poverty Correlation Chart
The statistical analysis conducted on geographies consisting of 217,129,888 people shows a substantial positive correlation between the proportion of Immigrants from Lebanon and poverty level in the United States with a correlation coefficient (R) of 0.509 and weighted average of 12.8%. Similarly, the statistical analysis conducted on geographies consisting of 104,846,826 people shows a moderate positive correlation between the proportion of Immigrants from Eritrea and poverty level in the United States with a correlation coefficient (R) of 0.480 and weighted average of 13.4%, a difference of 5.2%.
Poverty Correlation Summary
| Measurement | Immigrants from Lebanon | Immigrants from Eritrea |
| Minimum | 0.24% | 0.62% |
| Maximum | 33.6% | 45.5% |
| Range | 33.4% | 44.8% |
| Mean | 11.8% | 14.2% |
| Median | 10.2% | 12.6% |
| Interquartile 25% (IQ1) | 6.9% | 9.5% |
| Interquartile 75% (IQ3) | 13.7% | 16.0% |
| Interquartile Range (IQR) | 6.8% | 6.4% |
| Standard Deviation (Sample) | 8.0% | 8.6% |
| Standard Deviation (Population) | 7.9% | 8.5% |
Similar Demographics by Poverty
Demographics Similar to Immigrants from Lebanon by Poverty
In terms of poverty, the demographic groups most similar to Immigrants from Lebanon are Spanish (12.8%, a difference of 0.010%), Immigrants from Kenya (12.8%, a difference of 0.20%), Iraqi (12.7%, a difference of 0.31%), Immigrants from Kuwait (12.7%, a difference of 0.32%), and Spaniard (12.8%, a difference of 0.35%).
| Demographics | Rating | Rank | Poverty |
| Immigrants | South America | 32.3 /100 | #190 | Fair 12.5% |
| Sierra Leoneans | 31.5 /100 | #191 | Fair 12.6% |
| South American Indians | 23.3 /100 | #192 | Fair 12.7% |
| Delaware | 21.4 /100 | #193 | Fair 12.7% |
| Arabs | 21.1 /100 | #194 | Fair 12.7% |
| Immigrants | Kuwait | 20.9 /100 | #195 | Fair 12.7% |
| Iraqis | 20.8 /100 | #196 | Fair 12.7% |
| Immigrants | Lebanon | 18.7 /100 | #197 | Poor 12.8% |
| Spanish | 18.7 /100 | #198 | Poor 12.8% |
| Immigrants | Kenya | 17.5 /100 | #199 | Poor 12.8% |
| Spaniards | 16.5 /100 | #200 | Poor 12.8% |
| Immigrants | Uganda | 16.5 /100 | #201 | Poor 12.8% |
| Immigrants | Uruguay | 15.6 /100 | #202 | Poor 12.8% |
| Hmong | 15.0 /100 | #203 | Poor 12.8% |
| Immigrants | Western Asia | 14.1 /100 | #204 | Poor 12.9% |
Demographics Similar to Immigrants from Eritrea by Poverty
In terms of poverty, the demographic groups most similar to Immigrants from Eritrea are Immigrants from Africa (13.4%, a difference of 0.10%), Immigrants from Micronesia (13.4%, a difference of 0.14%), Alsatian (13.4%, a difference of 0.18%), German Russian (13.4%, a difference of 0.22%), and Marshallese (13.4%, a difference of 0.23%).
| Demographics | Rating | Rank | Poverty |
| Immigrants | Uzbekistan | 3.2 /100 | #217 | Tragic 13.3% |
| Immigrants | Thailand | 3.1 /100 | #218 | Tragic 13.3% |
| Immigrants | Cambodia | 3.0 /100 | #219 | Tragic 13.4% |
| Americans | 2.9 /100 | #220 | Tragic 13.4% |
| Alsatians | 2.6 /100 | #221 | Tragic 13.4% |
| Immigrants | Micronesia | 2.6 /100 | #222 | Tragic 13.4% |
| Immigrants | Africa | 2.5 /100 | #223 | Tragic 13.4% |
| Immigrants | Eritrea | 2.4 /100 | #224 | Tragic 13.4% |
| German Russians | 2.2 /100 | #225 | Tragic 13.4% |
| Marshallese | 2.2 /100 | #226 | Tragic 13.4% |
| Alaska Natives | 2.1 /100 | #227 | Tragic 13.5% |
| Immigrants | Nigeria | 1.7 /100 | #228 | Tragic 13.5% |
| Osage | 1.5 /100 | #229 | Tragic 13.6% |
| Alaskan Athabascans | 1.5 /100 | #230 | Tragic 13.6% |
| Nigerians | 1.4 /100 | #231 | Tragic 13.6% |