Icelander vs Immigrants from Eritrea Poverty
COMPARE
Icelander
Immigrants from Eritrea
Poverty
Poverty Comparison
Icelanders
Immigrants from Eritrea
11.9%
POVERTY
77.9/ 100
METRIC RATING
144th/ 347
METRIC RANK
13.4%
POVERTY
2.4/ 100
METRIC RATING
224th/ 347
METRIC RANK
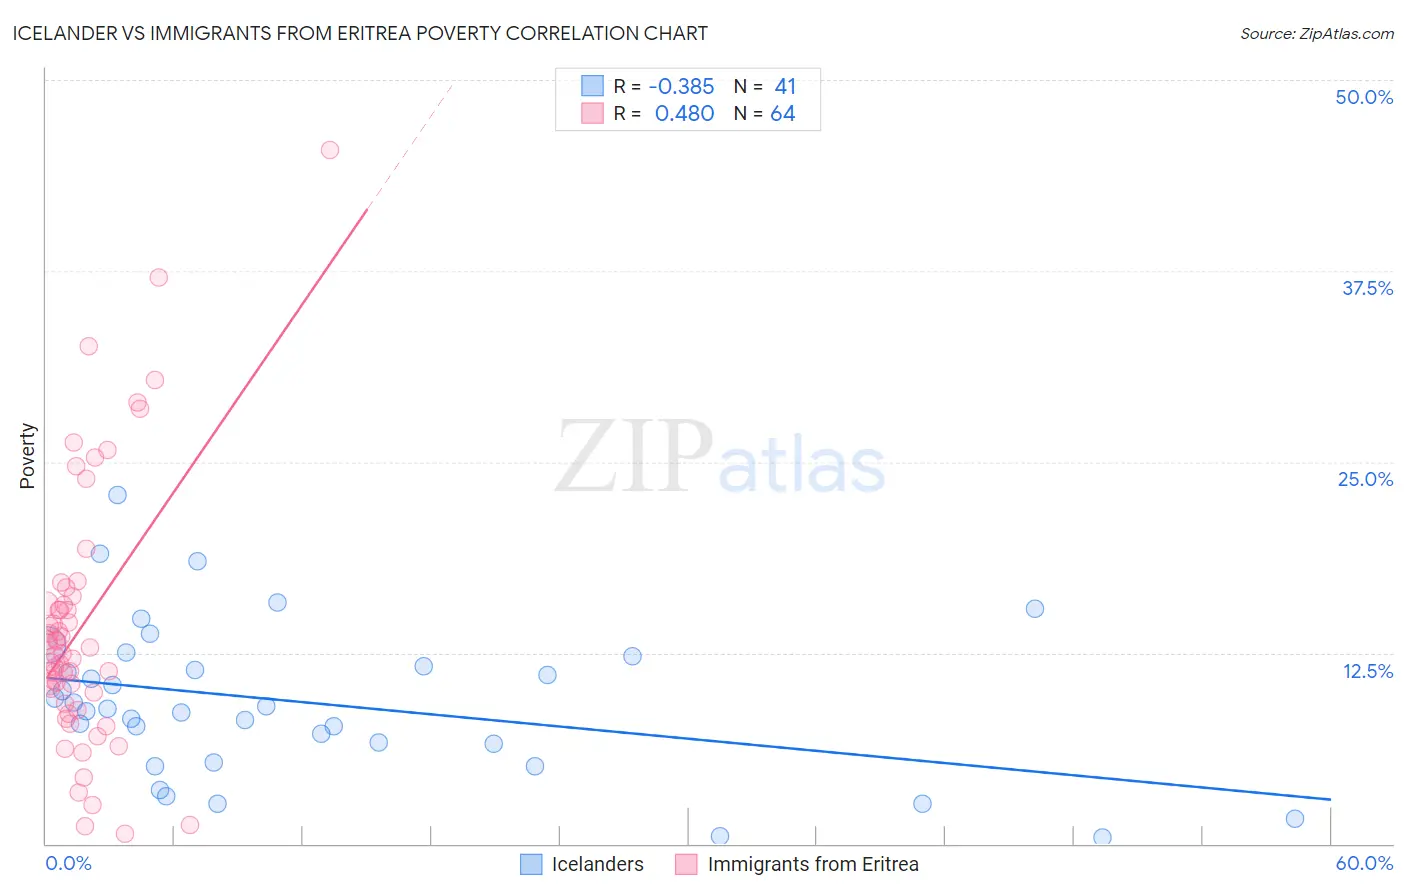
Icelander vs Immigrants from Eritrea Poverty Correlation Chart
The statistical analysis conducted on geographies consisting of 159,621,690 people shows a mild negative correlation between the proportion of Icelanders and poverty level in the United States with a correlation coefficient (R) of -0.385 and weighted average of 11.9%. Similarly, the statistical analysis conducted on geographies consisting of 104,846,826 people shows a moderate positive correlation between the proportion of Immigrants from Eritrea and poverty level in the United States with a correlation coefficient (R) of 0.480 and weighted average of 13.4%, a difference of 12.4%.
Poverty Correlation Summary
| Measurement | Icelander | Immigrants from Eritrea |
| Minimum | 0.44% | 0.62% |
| Maximum | 22.8% | 45.5% |
| Range | 22.4% | 44.8% |
| Mean | 9.2% | 14.2% |
| Median | 8.9% | 12.6% |
| Interquartile 25% (IQ1) | 5.9% | 9.5% |
| Interquartile 75% (IQ3) | 12.0% | 16.0% |
| Interquartile Range (IQR) | 6.0% | 6.4% |
| Standard Deviation (Sample) | 5.0% | 8.6% |
| Standard Deviation (Population) | 4.9% | 8.5% |
Similar Demographics by Poverty
Demographics Similar to Icelanders by Poverty
In terms of poverty, the demographic groups most similar to Icelanders are Brazilian (11.9%, a difference of 0.27%), Basque (11.9%, a difference of 0.38%), Syrian (12.0%, a difference of 0.38%), Immigrants from France (11.9%, a difference of 0.40%), and Afghan (12.0%, a difference of 0.42%).
| Demographics | Rating | Rank | Poverty |
| Immigrants | Switzerland | 83.0 /100 | #137 | Excellent 11.8% |
| Immigrants | Jordan | 82.4 /100 | #138 | Excellent 11.9% |
| Pakistanis | 82.2 /100 | #139 | Excellent 11.9% |
| Immigrants | Peru | 81.1 /100 | #140 | Excellent 11.9% |
| Immigrants | France | 80.5 /100 | #141 | Excellent 11.9% |
| Basques | 80.4 /100 | #142 | Excellent 11.9% |
| Brazilians | 79.7 /100 | #143 | Good 11.9% |
| Icelanders | 77.9 /100 | #144 | Good 11.9% |
| Syrians | 75.1 /100 | #145 | Good 12.0% |
| Afghans | 74.9 /100 | #146 | Good 12.0% |
| Immigrants | Bosnia and Herzegovina | 73.7 /100 | #147 | Good 12.0% |
| Immigrants | Germany | 72.7 /100 | #148 | Good 12.0% |
| Immigrants | Malaysia | 72.7 /100 | #149 | Good 12.0% |
| Immigrants | Kazakhstan | 72.3 /100 | #150 | Good 12.0% |
| Samoans | 71.9 /100 | #151 | Good 12.0% |
Demographics Similar to Immigrants from Eritrea by Poverty
In terms of poverty, the demographic groups most similar to Immigrants from Eritrea are Immigrants from Africa (13.4%, a difference of 0.10%), Immigrants from Micronesia (13.4%, a difference of 0.14%), Alsatian (13.4%, a difference of 0.18%), German Russian (13.4%, a difference of 0.22%), and Marshallese (13.4%, a difference of 0.23%).
| Demographics | Rating | Rank | Poverty |
| Immigrants | Uzbekistan | 3.2 /100 | #217 | Tragic 13.3% |
| Immigrants | Thailand | 3.1 /100 | #218 | Tragic 13.3% |
| Immigrants | Cambodia | 3.0 /100 | #219 | Tragic 13.4% |
| Americans | 2.9 /100 | #220 | Tragic 13.4% |
| Alsatians | 2.6 /100 | #221 | Tragic 13.4% |
| Immigrants | Micronesia | 2.6 /100 | #222 | Tragic 13.4% |
| Immigrants | Africa | 2.5 /100 | #223 | Tragic 13.4% |
| Immigrants | Eritrea | 2.4 /100 | #224 | Tragic 13.4% |
| German Russians | 2.2 /100 | #225 | Tragic 13.4% |
| Marshallese | 2.2 /100 | #226 | Tragic 13.4% |
| Alaska Natives | 2.1 /100 | #227 | Tragic 13.5% |
| Immigrants | Nigeria | 1.7 /100 | #228 | Tragic 13.5% |
| Osage | 1.5 /100 | #229 | Tragic 13.6% |
| Alaskan Athabascans | 1.5 /100 | #230 | Tragic 13.6% |
| Nigerians | 1.4 /100 | #231 | Tragic 13.6% |