Slovak vs Immigrants from Eritrea Poverty
COMPARE
Slovak
Immigrants from Eritrea
Poverty
Poverty Comparison
Slovaks
Immigrants from Eritrea
11.2%
POVERTY
97.4/ 100
METRIC RATING
68th/ 347
METRIC RANK
13.4%
POVERTY
2.4/ 100
METRIC RATING
224th/ 347
METRIC RANK
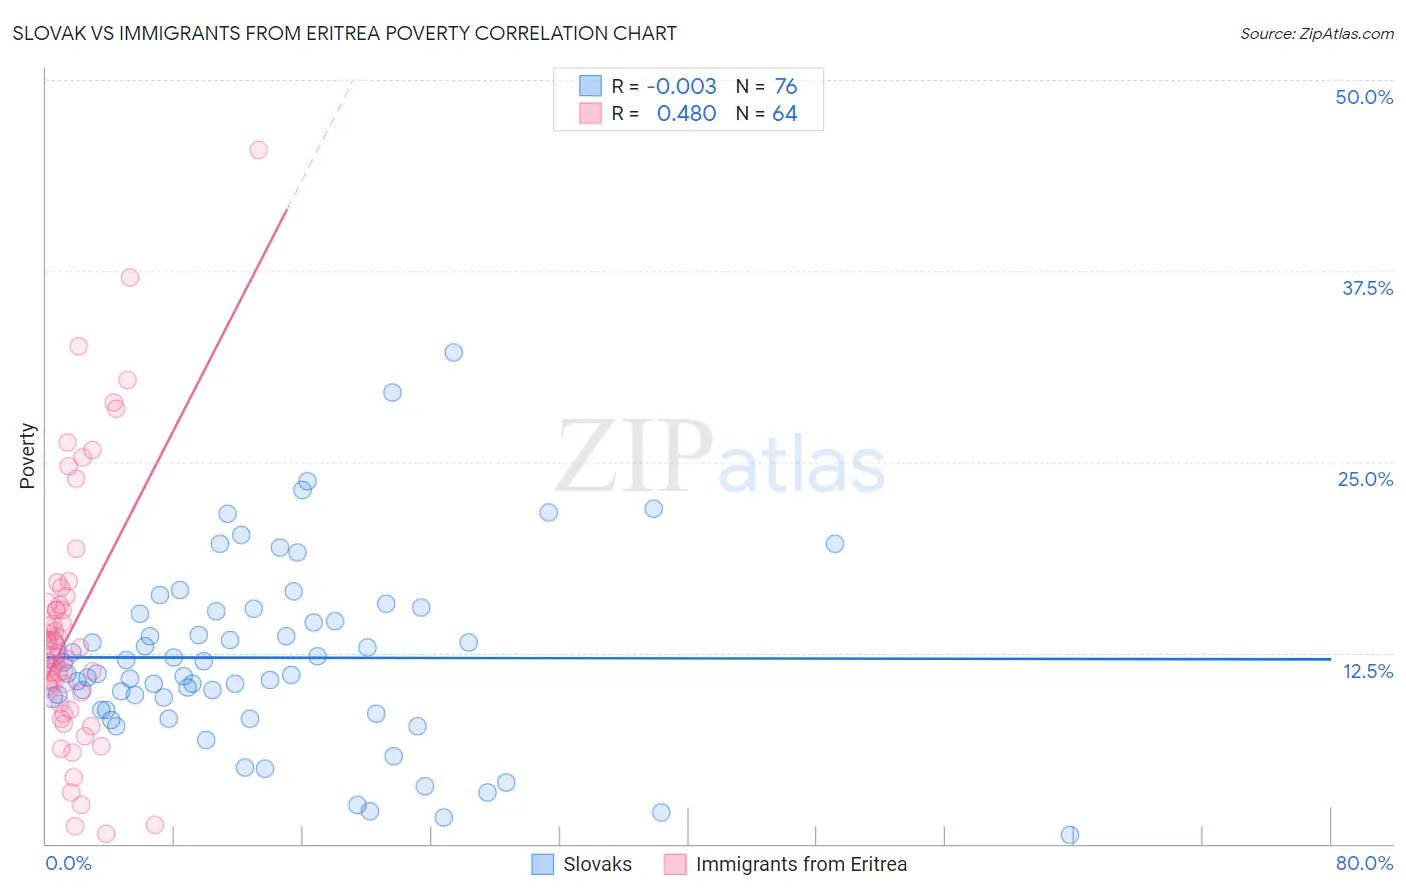
Slovak vs Immigrants from Eritrea Poverty Correlation Chart
The statistical analysis conducted on geographies consisting of 397,661,744 people shows no correlation between the proportion of Slovaks and poverty level in the United States with a correlation coefficient (R) of -0.003 and weighted average of 11.2%. Similarly, the statistical analysis conducted on geographies consisting of 104,846,826 people shows a moderate positive correlation between the proportion of Immigrants from Eritrea and poverty level in the United States with a correlation coefficient (R) of 0.480 and weighted average of 13.4%, a difference of 19.5%.
Poverty Correlation Summary
| Measurement | Slovak | Immigrants from Eritrea |
| Minimum | 0.55% | 0.62% |
| Maximum | 32.2% | 45.5% |
| Range | 31.6% | 44.8% |
| Mean | 12.2% | 14.2% |
| Median | 11.1% | 12.6% |
| Interquartile 25% (IQ1) | 8.8% | 9.5% |
| Interquartile 75% (IQ3) | 15.1% | 16.0% |
| Interquartile Range (IQR) | 6.4% | 6.4% |
| Standard Deviation (Sample) | 6.1% | 8.6% |
| Standard Deviation (Population) | 6.0% | 8.5% |
Similar Demographics by Poverty
Demographics Similar to Slovaks by Poverty
In terms of poverty, the demographic groups most similar to Slovaks are Immigrants from Australia (11.2%, a difference of 0.020%), Immigrants from Netherlands (11.2%, a difference of 0.060%), Serbian (11.2%, a difference of 0.060%), Immigrants from Asia (11.2%, a difference of 0.13%), and Immigrants from Canada (11.3%, a difference of 0.15%).
| Demographics | Rating | Rank | Poverty |
| Immigrants | Italy | 97.9 /100 | #61 | Exceptional 11.2% |
| Austrians | 97.8 /100 | #62 | Exceptional 11.2% |
| Ukrainians | 97.8 /100 | #63 | Exceptional 11.2% |
| Swiss | 97.7 /100 | #64 | Exceptional 11.2% |
| Immigrants | Asia | 97.5 /100 | #65 | Exceptional 11.2% |
| Immigrants | Netherlands | 97.5 /100 | #66 | Exceptional 11.2% |
| Immigrants | Australia | 97.4 /100 | #67 | Exceptional 11.2% |
| Slovaks | 97.4 /100 | #68 | Exceptional 11.2% |
| Serbians | 97.4 /100 | #69 | Exceptional 11.2% |
| Immigrants | Canada | 97.3 /100 | #70 | Exceptional 11.3% |
| Zimbabweans | 97.3 /100 | #71 | Exceptional 11.3% |
| Europeans | 97.2 /100 | #72 | Exceptional 11.3% |
| Immigrants | Belgium | 97.2 /100 | #73 | Exceptional 11.3% |
| Carpatho Rusyns | 97.2 /100 | #74 | Exceptional 11.3% |
| Immigrants | Eastern Europe | 97.0 /100 | #75 | Exceptional 11.3% |
Demographics Similar to Immigrants from Eritrea by Poverty
In terms of poverty, the demographic groups most similar to Immigrants from Eritrea are Immigrants from Africa (13.4%, a difference of 0.10%), Immigrants from Micronesia (13.4%, a difference of 0.14%), Alsatian (13.4%, a difference of 0.18%), German Russian (13.4%, a difference of 0.22%), and Marshallese (13.4%, a difference of 0.23%).
| Demographics | Rating | Rank | Poverty |
| Immigrants | Uzbekistan | 3.2 /100 | #217 | Tragic 13.3% |
| Immigrants | Thailand | 3.1 /100 | #218 | Tragic 13.3% |
| Immigrants | Cambodia | 3.0 /100 | #219 | Tragic 13.4% |
| Americans | 2.9 /100 | #220 | Tragic 13.4% |
| Alsatians | 2.6 /100 | #221 | Tragic 13.4% |
| Immigrants | Micronesia | 2.6 /100 | #222 | Tragic 13.4% |
| Immigrants | Africa | 2.5 /100 | #223 | Tragic 13.4% |
| Immigrants | Eritrea | 2.4 /100 | #224 | Tragic 13.4% |
| German Russians | 2.2 /100 | #225 | Tragic 13.4% |
| Marshallese | 2.2 /100 | #226 | Tragic 13.4% |
| Alaska Natives | 2.1 /100 | #227 | Tragic 13.5% |
| Immigrants | Nigeria | 1.7 /100 | #228 | Tragic 13.5% |
| Osage | 1.5 /100 | #229 | Tragic 13.6% |
| Alaskan Athabascans | 1.5 /100 | #230 | Tragic 13.6% |
| Nigerians | 1.4 /100 | #231 | Tragic 13.6% |