Immigrants from Western Africa vs Immigrants from Eritrea Poverty
COMPARE
Immigrants from Western Africa
Immigrants from Eritrea
Poverty
Poverty Comparison
Immigrants from Western Africa
Immigrants from Eritrea
14.1%
POVERTY
0.2/ 100
METRIC RATING
248th/ 347
METRIC RANK
13.4%
POVERTY
2.4/ 100
METRIC RATING
224th/ 347
METRIC RANK
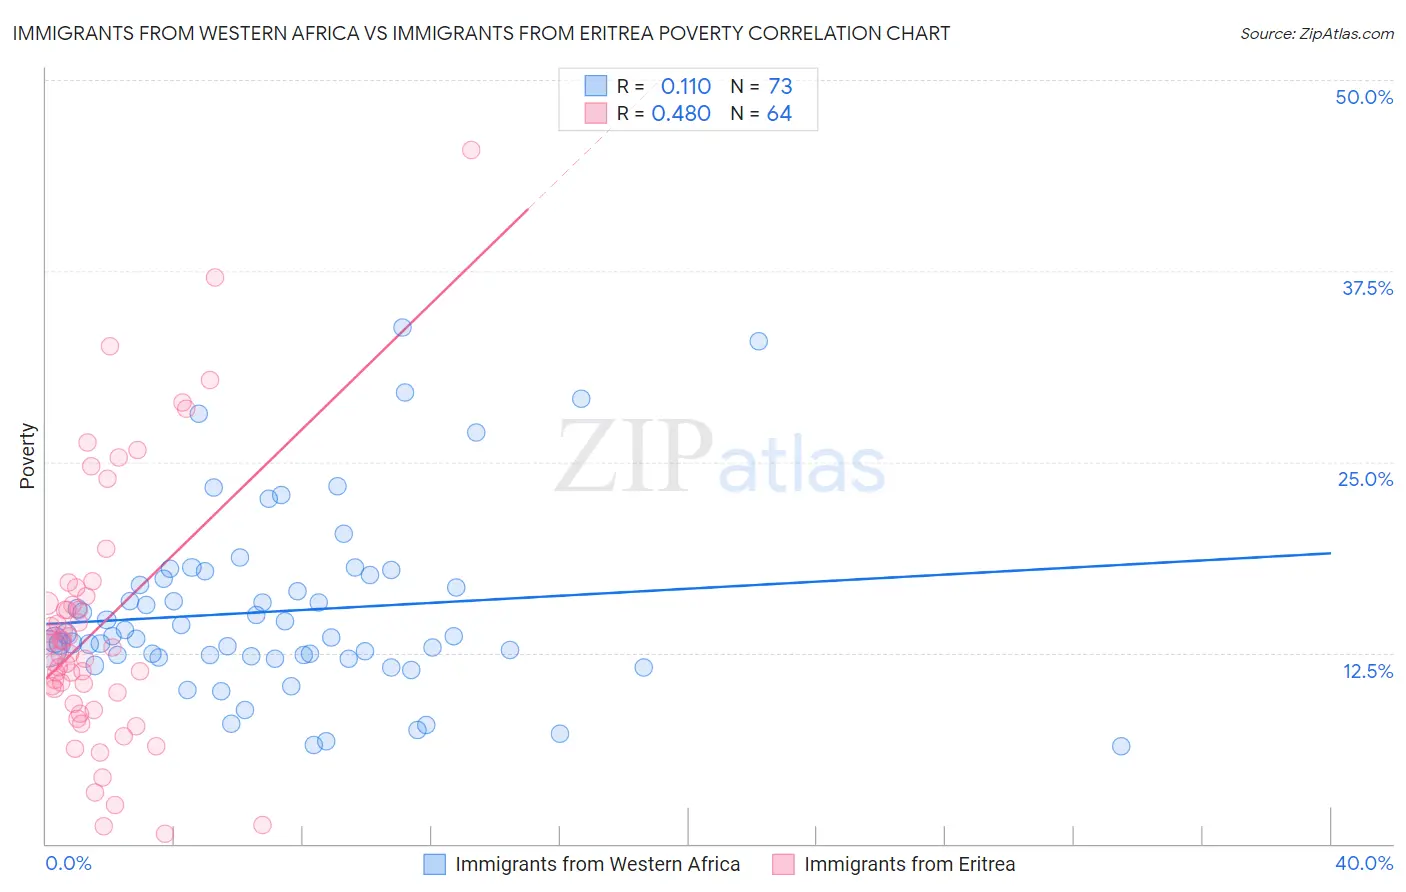
Immigrants from Western Africa vs Immigrants from Eritrea Poverty Correlation Chart
The statistical analysis conducted on geographies consisting of 357,561,912 people shows a poor positive correlation between the proportion of Immigrants from Western Africa and poverty level in the United States with a correlation coefficient (R) of 0.110 and weighted average of 14.1%. Similarly, the statistical analysis conducted on geographies consisting of 104,846,826 people shows a moderate positive correlation between the proportion of Immigrants from Eritrea and poverty level in the United States with a correlation coefficient (R) of 0.480 and weighted average of 13.4%, a difference of 5.4%.
Poverty Correlation Summary
| Measurement | Immigrants from Western Africa | Immigrants from Eritrea |
| Minimum | 6.4% | 0.62% |
| Maximum | 33.8% | 45.5% |
| Range | 27.5% | 44.8% |
| Mean | 15.2% | 14.2% |
| Median | 13.5% | 12.6% |
| Interquartile 25% (IQ1) | 12.3% | 9.5% |
| Interquartile 75% (IQ3) | 17.5% | 16.0% |
| Interquartile Range (IQR) | 5.2% | 6.4% |
| Standard Deviation (Sample) | 5.9% | 8.6% |
| Standard Deviation (Population) | 5.8% | 8.5% |
Similar Demographics by Poverty
Demographics Similar to Immigrants from Western Africa by Poverty
In terms of poverty, the demographic groups most similar to Immigrants from Western Africa are Liberian (14.1%, a difference of 0.020%), Immigrants from Ghana (14.2%, a difference of 0.090%), Potawatomi (14.1%, a difference of 0.30%), Cree (14.2%, a difference of 0.39%), and Immigrants from Burma/Myanmar (14.2%, a difference of 0.48%).
| Demographics | Rating | Rank | Poverty |
| Salvadorans | 0.4 /100 | #241 | Tragic 14.0% |
| Ecuadorians | 0.4 /100 | #242 | Tragic 14.0% |
| Sudanese | 0.3 /100 | #243 | Tragic 14.0% |
| Nepalese | 0.3 /100 | #244 | Tragic 14.0% |
| Immigrants | Sudan | 0.3 /100 | #245 | Tragic 14.1% |
| Potawatomi | 0.3 /100 | #246 | Tragic 14.1% |
| Liberians | 0.2 /100 | #247 | Tragic 14.1% |
| Immigrants | Western Africa | 0.2 /100 | #248 | Tragic 14.1% |
| Immigrants | Ghana | 0.2 /100 | #249 | Tragic 14.2% |
| Cree | 0.2 /100 | #250 | Tragic 14.2% |
| Immigrants | Burma/Myanmar | 0.2 /100 | #251 | Tragic 14.2% |
| Spanish American Indians | 0.2 /100 | #252 | Tragic 14.2% |
| Immigrants | Trinidad and Tobago | 0.2 /100 | #253 | Tragic 14.2% |
| Immigrants | El Salvador | 0.1 /100 | #254 | Tragic 14.3% |
| Immigrants | Ecuador | 0.1 /100 | #255 | Tragic 14.3% |
Demographics Similar to Immigrants from Eritrea by Poverty
In terms of poverty, the demographic groups most similar to Immigrants from Eritrea are Immigrants from Africa (13.4%, a difference of 0.10%), Immigrants from Micronesia (13.4%, a difference of 0.14%), Alsatian (13.4%, a difference of 0.18%), German Russian (13.4%, a difference of 0.22%), and Marshallese (13.4%, a difference of 0.23%).
| Demographics | Rating | Rank | Poverty |
| Immigrants | Uzbekistan | 3.2 /100 | #217 | Tragic 13.3% |
| Immigrants | Thailand | 3.1 /100 | #218 | Tragic 13.3% |
| Immigrants | Cambodia | 3.0 /100 | #219 | Tragic 13.4% |
| Americans | 2.9 /100 | #220 | Tragic 13.4% |
| Alsatians | 2.6 /100 | #221 | Tragic 13.4% |
| Immigrants | Micronesia | 2.6 /100 | #222 | Tragic 13.4% |
| Immigrants | Africa | 2.5 /100 | #223 | Tragic 13.4% |
| Immigrants | Eritrea | 2.4 /100 | #224 | Tragic 13.4% |
| German Russians | 2.2 /100 | #225 | Tragic 13.4% |
| Marshallese | 2.2 /100 | #226 | Tragic 13.4% |
| Alaska Natives | 2.1 /100 | #227 | Tragic 13.5% |
| Immigrants | Nigeria | 1.7 /100 | #228 | Tragic 13.5% |
| Osage | 1.5 /100 | #229 | Tragic 13.6% |
| Alaskan Athabascans | 1.5 /100 | #230 | Tragic 13.6% |
| Nigerians | 1.4 /100 | #231 | Tragic 13.6% |