South African vs Salvadoran Single Female Poverty
COMPARE
South African
Salvadoran
Single Female Poverty
Single Female Poverty Comparison
South Africans
Salvadorans
20.4%
SINGLE FEMALE POVERTY
85.3/ 100
METRIC RATING
147th/ 347
METRIC RANK
21.9%
SINGLE FEMALE POVERTY
5.5/ 100
METRIC RATING
228th/ 347
METRIC RANK
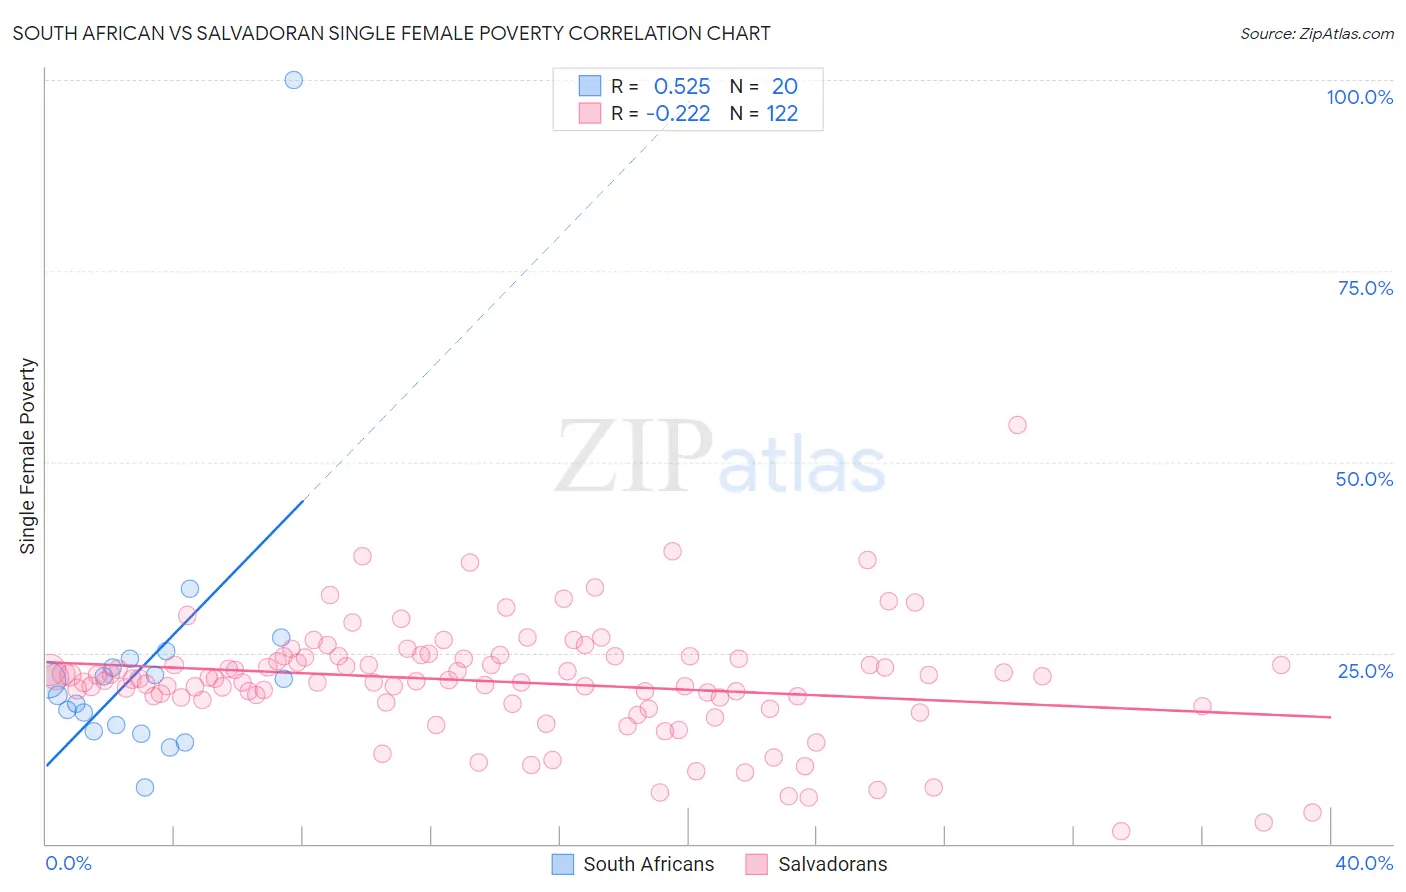
South African vs Salvadoran Single Female Poverty Correlation Chart
The statistical analysis conducted on geographies consisting of 180,862,310 people shows a substantial positive correlation between the proportion of South Africans and poverty level among single females in the United States with a correlation coefficient (R) of 0.525 and weighted average of 20.4%. Similarly, the statistical analysis conducted on geographies consisting of 394,529,574 people shows a weak negative correlation between the proportion of Salvadorans and poverty level among single females in the United States with a correlation coefficient (R) of -0.222 and weighted average of 21.9%, a difference of 7.4%.
Single Female Poverty Correlation Summary
| Measurement | South African | Salvadoran |
| Minimum | 7.4% | 1.6% |
| Maximum | 100.0% | 54.8% |
| Range | 92.6% | 53.2% |
| Mean | 23.5% | 21.2% |
| Median | 20.4% | 21.5% |
| Interquartile 25% (IQ1) | 15.2% | 18.8% |
| Interquartile 75% (IQ3) | 23.6% | 24.3% |
| Interquartile Range (IQR) | 8.4% | 5.5% |
| Standard Deviation (Sample) | 18.9% | 7.6% |
| Standard Deviation (Population) | 18.4% | 7.5% |
Similar Demographics by Single Female Poverty
Demographics Similar to South Africans by Single Female Poverty
In terms of single female poverty, the demographic groups most similar to South Africans are Venezuelan (20.4%, a difference of 0.030%), Luxembourger (20.4%, a difference of 0.050%), Austrian (20.4%, a difference of 0.060%), Immigrants from Uzbekistan (20.3%, a difference of 0.42%), and Australian (20.3%, a difference of 0.43%).
| Demographics | Rating | Rank | Single Female Poverty |
| Syrians | 90.4 /100 | #140 | Exceptional 20.3% |
| Immigrants | North America | 89.5 /100 | #141 | Excellent 20.3% |
| Immigrants | Uganda | 89.1 /100 | #142 | Excellent 20.3% |
| Australians | 88.4 /100 | #143 | Excellent 20.3% |
| Immigrants | Uzbekistan | 88.3 /100 | #144 | Excellent 20.3% |
| Austrians | 85.8 /100 | #145 | Excellent 20.4% |
| Venezuelans | 85.5 /100 | #146 | Excellent 20.4% |
| South Africans | 85.3 /100 | #147 | Excellent 20.4% |
| Luxembourgers | 84.9 /100 | #148 | Excellent 20.4% |
| Portuguese | 81.5 /100 | #149 | Excellent 20.5% |
| Immigrants | Denmark | 80.5 /100 | #150 | Excellent 20.5% |
| Puget Sound Salish | 79.6 /100 | #151 | Good 20.6% |
| Immigrants | Uruguay | 77.7 /100 | #152 | Good 20.6% |
| Swedes | 77.1 /100 | #153 | Good 20.6% |
| Immigrants | Western Europe | 76.7 /100 | #154 | Good 20.6% |
Demographics Similar to Salvadorans by Single Female Poverty
In terms of single female poverty, the demographic groups most similar to Salvadorans are Tlingit-Haida (21.9%, a difference of 0.030%), Immigrants from Western Africa (22.0%, a difference of 0.050%), Immigrants from Portugal (21.9%, a difference of 0.10%), Immigrants from Ghana (21.9%, a difference of 0.10%), and Welsh (22.0%, a difference of 0.14%).
| Demographics | Rating | Rank | Single Female Poverty |
| Immigrants | Grenada | 8.0 /100 | #221 | Tragic 21.8% |
| Immigrants | Eritrea | 7.9 /100 | #222 | Tragic 21.8% |
| Scottish | 7.3 /100 | #223 | Tragic 21.8% |
| Barbadians | 7.2 /100 | #224 | Tragic 21.8% |
| English | 6.4 /100 | #225 | Tragic 21.9% |
| Immigrants | Portugal | 5.8 /100 | #226 | Tragic 21.9% |
| Immigrants | Ghana | 5.8 /100 | #227 | Tragic 21.9% |
| Salvadorans | 5.5 /100 | #228 | Tragic 21.9% |
| Tlingit-Haida | 5.4 /100 | #229 | Tragic 21.9% |
| Immigrants | Western Africa | 5.3 /100 | #230 | Tragic 22.0% |
| Welsh | 5.0 /100 | #231 | Tragic 22.0% |
| Immigrants | Thailand | 5.0 /100 | #232 | Tragic 22.0% |
| Spaniards | 4.7 /100 | #233 | Tragic 22.0% |
| Spanish | 4.7 /100 | #234 | Tragic 22.0% |
| Dutch | 4.6 /100 | #235 | Tragic 22.0% |