Yuman vs Salvadoran Per Capita Income
COMPARE
Yuman
Salvadoran
Per Capita Income
Per Capita Income Comparison
Yuman
Salvadorans
$33,236
PER CAPITA INCOME
0.0/ 100
METRIC RATING
335th/ 347
METRIC RANK
$38,858
PER CAPITA INCOME
0.5/ 100
METRIC RATING
266th/ 347
METRIC RANK
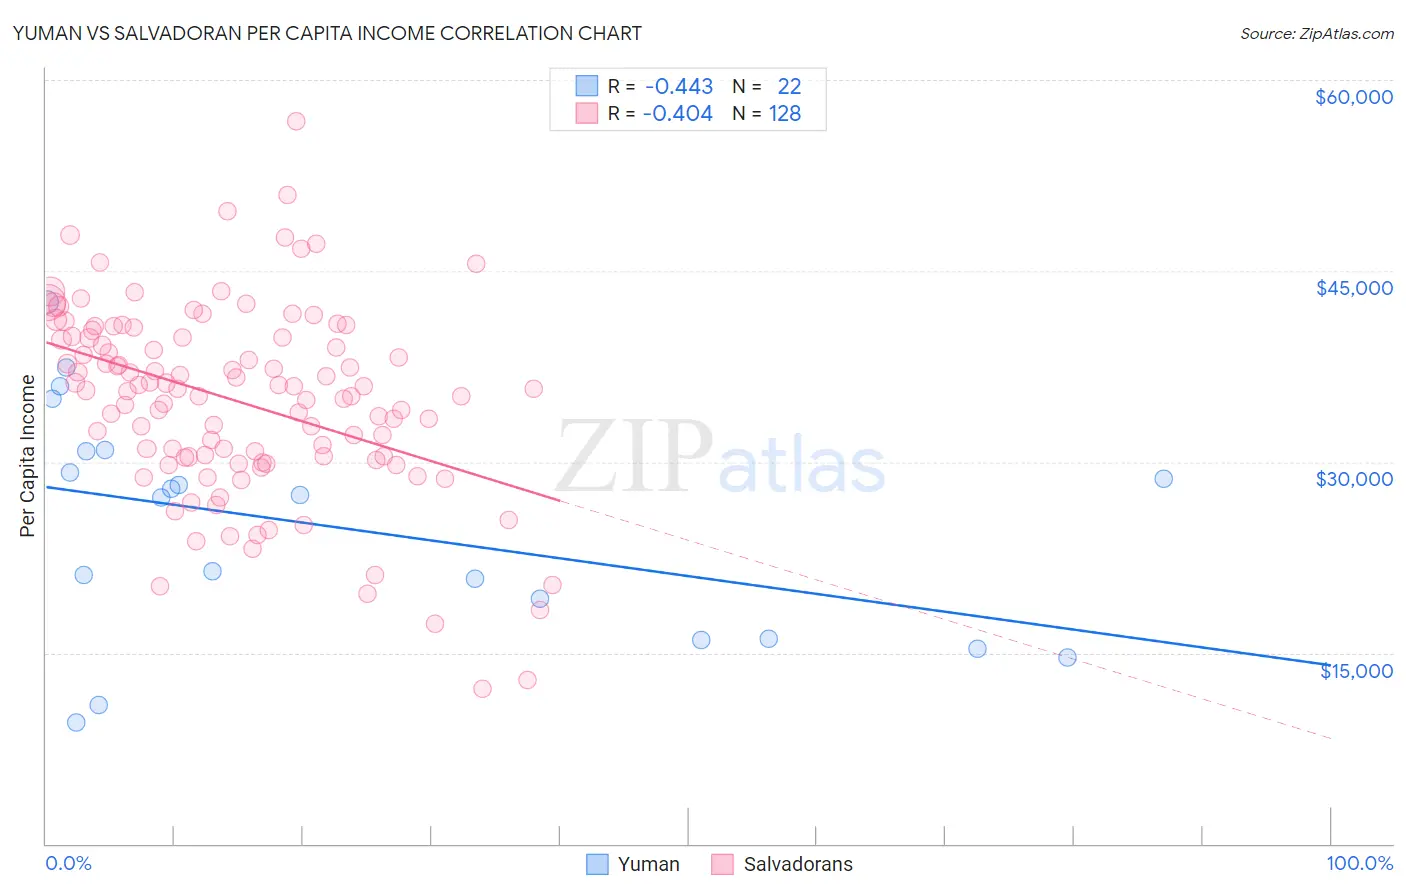
Yuman vs Salvadoran Per Capita Income Correlation Chart
The statistical analysis conducted on geographies consisting of 40,696,310 people shows a moderate negative correlation between the proportion of Yuman and per capita income in the United States with a correlation coefficient (R) of -0.443 and weighted average of $33,236. Similarly, the statistical analysis conducted on geographies consisting of 399,090,197 people shows a moderate negative correlation between the proportion of Salvadorans and per capita income in the United States with a correlation coefficient (R) of -0.404 and weighted average of $38,858, a difference of 16.9%.
Per Capita Income Correlation Summary
| Measurement | Yuman | Salvadoran |
| Minimum | $9,533 | $12,183 |
| Maximum | $42,569 | $56,804 |
| Range | $33,036 | $44,621 |
| Mean | $24,831 | $34,754 |
| Median | $27,284 | $35,664 |
| Interquartile 25% (IQ1) | $16,137 | $30,375 |
| Interquartile 75% (IQ3) | $30,879 | $39,784 |
| Interquartile Range (IQR) | $14,742 | $9,409 |
| Standard Deviation (Sample) | $8,979 | $7,521 |
| Standard Deviation (Population) | $8,772 | $7,492 |
Similar Demographics by Per Capita Income
Demographics Similar to Yuman by Per Capita Income
In terms of per capita income, the demographic groups most similar to Yuman are Native/Alaskan ($33,279, a difference of 0.13%), Yakama ($33,009, a difference of 0.69%), Houma ($32,996, a difference of 0.73%), Immigrants from Yemen ($33,696, a difference of 1.4%), and Sioux ($33,921, a difference of 2.1%).
| Demographics | Rating | Rank | Per Capita Income |
| Menominee | 0.0 /100 | #328 | Tragic $34,578 |
| Mexicans | 0.0 /100 | #329 | Tragic $34,559 |
| Spanish American Indians | 0.0 /100 | #330 | Tragic $34,195 |
| Immigrants | Mexico | 0.0 /100 | #331 | Tragic $33,931 |
| Sioux | 0.0 /100 | #332 | Tragic $33,921 |
| Immigrants | Yemen | 0.0 /100 | #333 | Tragic $33,696 |
| Natives/Alaskans | 0.0 /100 | #334 | Tragic $33,279 |
| Yuman | 0.0 /100 | #335 | Tragic $33,236 |
| Yakama | 0.0 /100 | #336 | Tragic $33,009 |
| Houma | 0.0 /100 | #337 | Tragic $32,996 |
| Arapaho | 0.0 /100 | #338 | Tragic $32,345 |
| Pueblo | 0.0 /100 | #339 | Tragic $32,012 |
| Crow | 0.0 /100 | #340 | Tragic $31,729 |
| Puerto Ricans | 0.0 /100 | #341 | Tragic $31,268 |
| Hopi | 0.0 /100 | #342 | Tragic $31,177 |
Demographics Similar to Salvadorans by Per Capita Income
In terms of per capita income, the demographic groups most similar to Salvadorans are Immigrants from Zaire ($38,848, a difference of 0.030%), Liberian ($38,780, a difference of 0.20%), Immigrants from Jamaica ($38,766, a difference of 0.24%), Spanish American ($39,012, a difference of 0.40%), and American ($39,039, a difference of 0.47%).
| Demographics | Rating | Rank | Per Capita Income |
| Malaysians | 0.7 /100 | #259 | Tragic $39,194 |
| Alaskan Athabascans | 0.6 /100 | #260 | Tragic $39,163 |
| Marshallese | 0.6 /100 | #261 | Tragic $39,108 |
| Iroquois | 0.6 /100 | #262 | Tragic $39,104 |
| Belizeans | 0.6 /100 | #263 | Tragic $39,097 |
| Americans | 0.6 /100 | #264 | Tragic $39,039 |
| Spanish Americans | 0.5 /100 | #265 | Tragic $39,012 |
| Salvadorans | 0.5 /100 | #266 | Tragic $38,858 |
| Immigrants | Zaire | 0.4 /100 | #267 | Tragic $38,848 |
| Liberians | 0.4 /100 | #268 | Tragic $38,780 |
| Immigrants | Jamaica | 0.4 /100 | #269 | Tragic $38,766 |
| Immigrants | Belize | 0.3 /100 | #270 | Tragic $38,614 |
| Central Americans | 0.3 /100 | #271 | Tragic $38,560 |
| Immigrants | Cabo Verde | 0.3 /100 | #272 | Tragic $38,540 |
| Nepalese | 0.3 /100 | #273 | Tragic $38,442 |