Somali vs Salvadoran Single Female Poverty
COMPARE
Somali
Salvadoran
Single Female Poverty
Single Female Poverty Comparison
Somalis
Salvadorans
25.2%
SINGLE FEMALE POVERTY
0.0/ 100
METRIC RATING
303rd/ 347
METRIC RANK
21.9%
SINGLE FEMALE POVERTY
5.5/ 100
METRIC RATING
228th/ 347
METRIC RANK
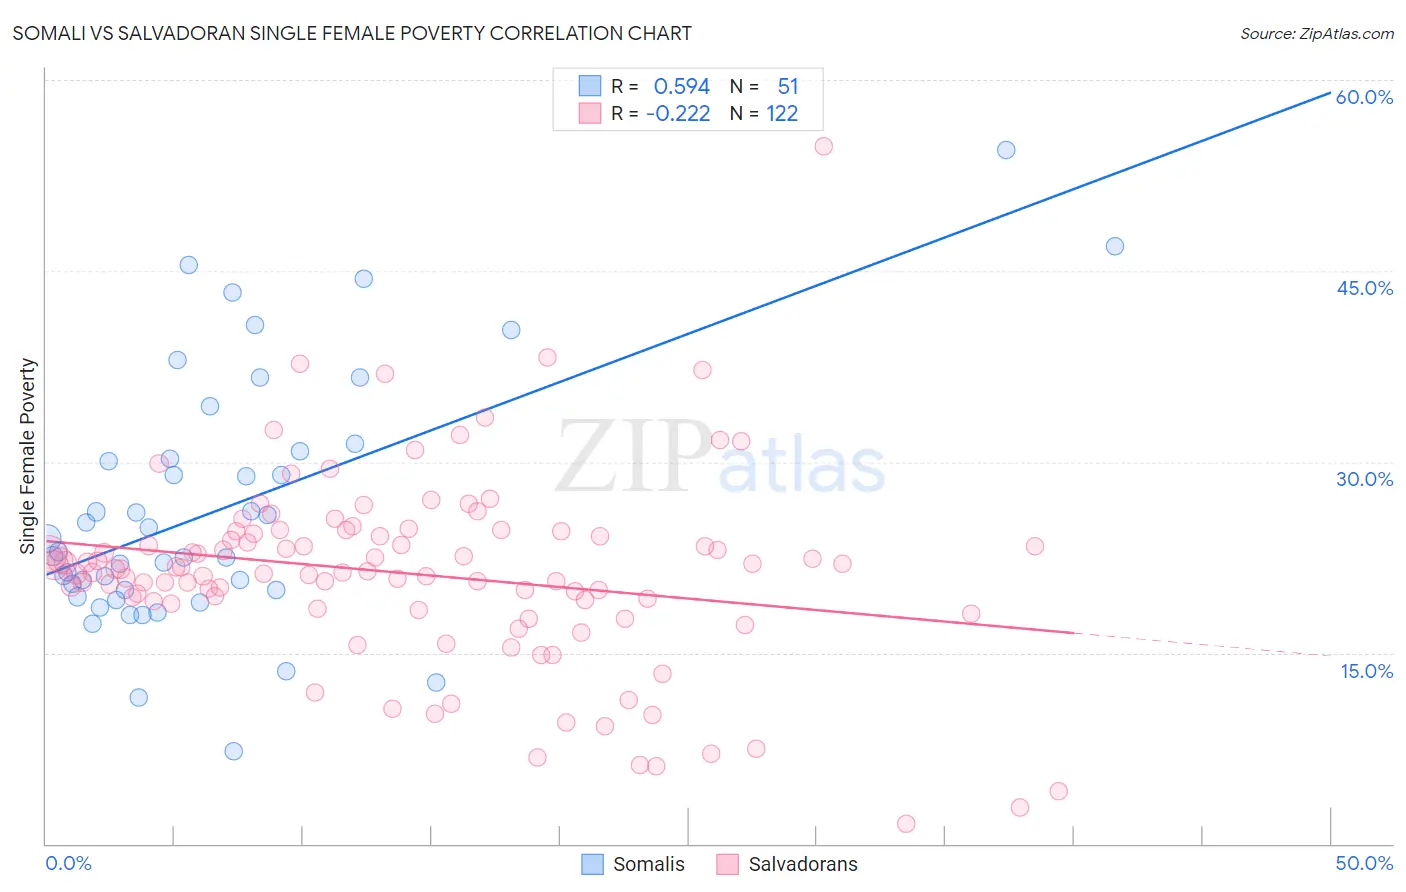
Somali vs Salvadoran Single Female Poverty Correlation Chart
The statistical analysis conducted on geographies consisting of 99,025,014 people shows a substantial positive correlation between the proportion of Somalis and poverty level among single females in the United States with a correlation coefficient (R) of 0.594 and weighted average of 25.2%. Similarly, the statistical analysis conducted on geographies consisting of 394,529,574 people shows a weak negative correlation between the proportion of Salvadorans and poverty level among single females in the United States with a correlation coefficient (R) of -0.222 and weighted average of 21.9%, a difference of 15.0%.
Single Female Poverty Correlation Summary
| Measurement | Somali | Salvadoran |
| Minimum | 7.2% | 1.6% |
| Maximum | 54.5% | 54.8% |
| Range | 47.2% | 53.2% |
| Mean | 26.3% | 21.2% |
| Median | 23.0% | 21.5% |
| Interquartile 25% (IQ1) | 19.9% | 18.8% |
| Interquartile 75% (IQ3) | 30.8% | 24.3% |
| Interquartile Range (IQR) | 10.9% | 5.5% |
| Standard Deviation (Sample) | 9.9% | 7.6% |
| Standard Deviation (Population) | 9.8% | 7.5% |
Similar Demographics by Single Female Poverty
Demographics Similar to Somalis by Single Female Poverty
In terms of single female poverty, the demographic groups most similar to Somalis are Immigrants from Congo (25.3%, a difference of 0.27%), Immigrants from Dominican Republic (25.3%, a difference of 0.28%), Immigrants from Mexico (25.3%, a difference of 0.38%), Shoshone (25.1%, a difference of 0.40%), and Honduran (25.1%, a difference of 0.48%).
| Demographics | Rating | Rank | Single Female Poverty |
| Africans | 0.0 /100 | #296 | Tragic 24.8% |
| Immigrants | Central America | 0.0 /100 | #297 | Tragic 24.8% |
| Yaqui | 0.0 /100 | #298 | Tragic 24.9% |
| Mexicans | 0.0 /100 | #299 | Tragic 25.0% |
| Blackfeet | 0.0 /100 | #300 | Tragic 25.1% |
| Hondurans | 0.0 /100 | #301 | Tragic 25.1% |
| Shoshone | 0.0 /100 | #302 | Tragic 25.1% |
| Somalis | 0.0 /100 | #303 | Tragic 25.2% |
| Immigrants | Congo | 0.0 /100 | #304 | Tragic 25.3% |
| Immigrants | Dominican Republic | 0.0 /100 | #305 | Tragic 25.3% |
| Immigrants | Mexico | 0.0 /100 | #306 | Tragic 25.3% |
| Potawatomi | 0.0 /100 | #307 | Tragic 25.4% |
| Aleuts | 0.0 /100 | #308 | Tragic 25.4% |
| Dominicans | 0.0 /100 | #309 | Tragic 25.4% |
| Central American Indians | 0.0 /100 | #310 | Tragic 25.5% |
Demographics Similar to Salvadorans by Single Female Poverty
In terms of single female poverty, the demographic groups most similar to Salvadorans are Tlingit-Haida (21.9%, a difference of 0.030%), Immigrants from Western Africa (22.0%, a difference of 0.050%), Immigrants from Portugal (21.9%, a difference of 0.10%), Immigrants from Ghana (21.9%, a difference of 0.10%), and Welsh (22.0%, a difference of 0.14%).
| Demographics | Rating | Rank | Single Female Poverty |
| Immigrants | Grenada | 8.0 /100 | #221 | Tragic 21.8% |
| Immigrants | Eritrea | 7.9 /100 | #222 | Tragic 21.8% |
| Scottish | 7.3 /100 | #223 | Tragic 21.8% |
| Barbadians | 7.2 /100 | #224 | Tragic 21.8% |
| English | 6.4 /100 | #225 | Tragic 21.9% |
| Immigrants | Portugal | 5.8 /100 | #226 | Tragic 21.9% |
| Immigrants | Ghana | 5.8 /100 | #227 | Tragic 21.9% |
| Salvadorans | 5.5 /100 | #228 | Tragic 21.9% |
| Tlingit-Haida | 5.4 /100 | #229 | Tragic 21.9% |
| Immigrants | Western Africa | 5.3 /100 | #230 | Tragic 22.0% |
| Welsh | 5.0 /100 | #231 | Tragic 22.0% |
| Immigrants | Thailand | 5.0 /100 | #232 | Tragic 22.0% |
| Spaniards | 4.7 /100 | #233 | Tragic 22.0% |
| Spanish | 4.7 /100 | #234 | Tragic 22.0% |
| Dutch | 4.6 /100 | #235 | Tragic 22.0% |