Spaniard vs Immigrants from Congo Single Female Poverty
COMPARE
Spaniard
Immigrants from Congo
Single Female Poverty
Single Female Poverty Comparison
Spaniards
Immigrants from Congo
22.0%
SINGLE FEMALE POVERTY
4.7/ 100
METRIC RATING
233rd/ 347
METRIC RANK
25.3%
SINGLE FEMALE POVERTY
0.0/ 100
METRIC RATING
304th/ 347
METRIC RANK
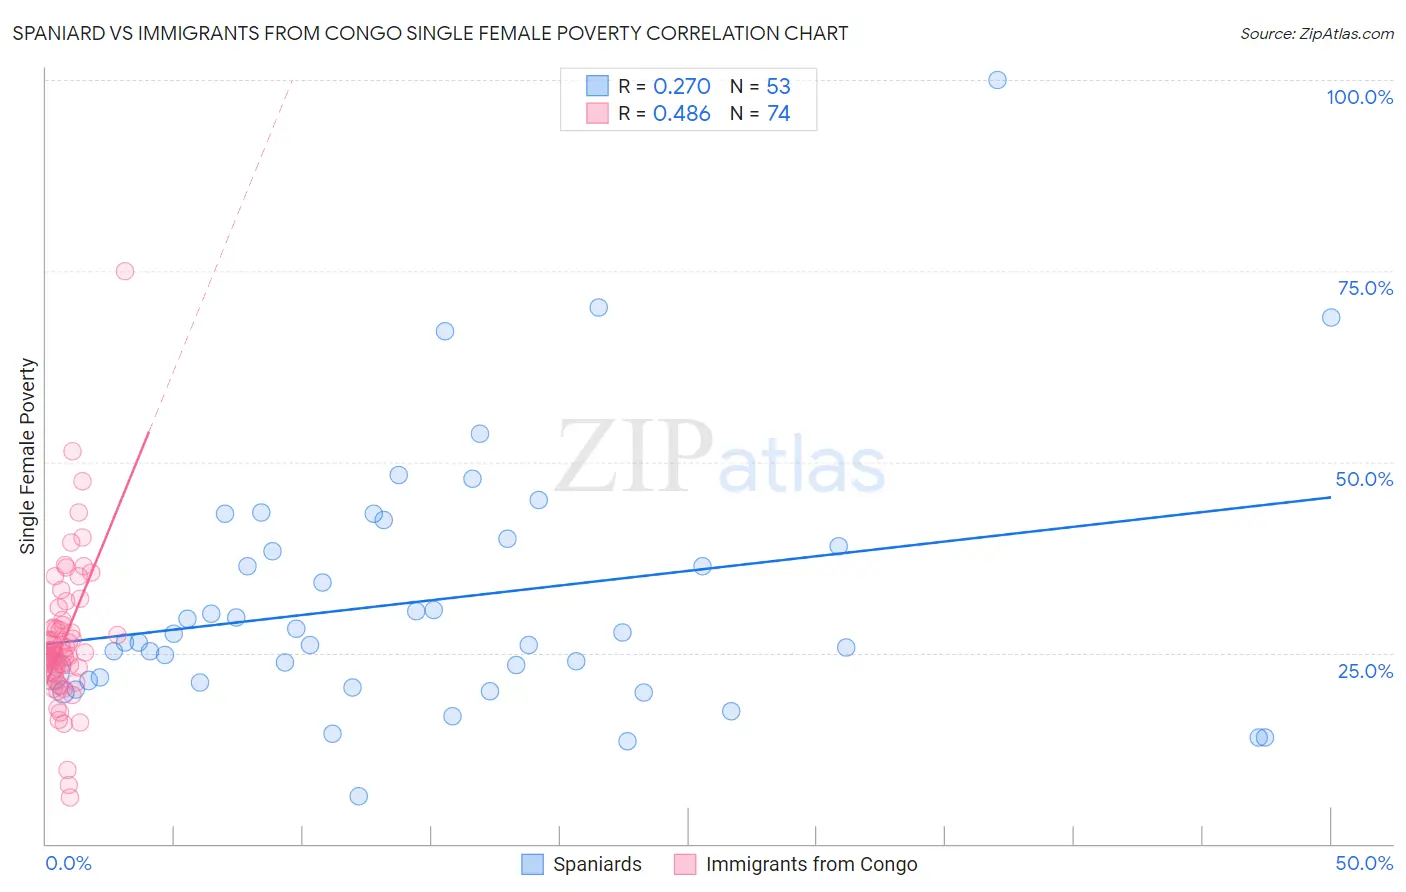
Spaniard vs Immigrants from Congo Single Female Poverty Correlation Chart
The statistical analysis conducted on geographies consisting of 435,429,561 people shows a weak positive correlation between the proportion of Spaniards and poverty level among single females in the United States with a correlation coefficient (R) of 0.270 and weighted average of 22.0%. Similarly, the statistical analysis conducted on geographies consisting of 91,983,877 people shows a moderate positive correlation between the proportion of Immigrants from Congo and poverty level among single females in the United States with a correlation coefficient (R) of 0.486 and weighted average of 25.3%, a difference of 15.0%.
Single Female Poverty Correlation Summary
| Measurement | Spaniard | Immigrants from Congo |
| Minimum | 6.3% | 6.1% |
| Maximum | 100.0% | 75.0% |
| Range | 93.7% | 68.9% |
| Mean | 31.9% | 26.6% |
| Median | 26.3% | 24.9% |
| Interquartile 25% (IQ1) | 21.2% | 22.7% |
| Interquartile 75% (IQ3) | 39.4% | 28.3% |
| Interquartile Range (IQR) | 18.2% | 5.6% |
| Standard Deviation (Sample) | 16.8% | 9.6% |
| Standard Deviation (Population) | 16.6% | 9.5% |
Similar Demographics by Single Female Poverty
Demographics Similar to Spaniards by Single Female Poverty
In terms of single female poverty, the demographic groups most similar to Spaniards are Spanish (22.0%, a difference of 0.0%), Dutch (22.0%, a difference of 0.020%), Immigrants from Thailand (22.0%, a difference of 0.090%), Welsh (22.0%, a difference of 0.11%), and Immigrants from Ecuador (22.0%, a difference of 0.18%).
| Demographics | Rating | Rank | Single Female Poverty |
| Immigrants | Portugal | 5.8 /100 | #226 | Tragic 21.9% |
| Immigrants | Ghana | 5.8 /100 | #227 | Tragic 21.9% |
| Salvadorans | 5.5 /100 | #228 | Tragic 21.9% |
| Tlingit-Haida | 5.4 /100 | #229 | Tragic 21.9% |
| Immigrants | Western Africa | 5.3 /100 | #230 | Tragic 22.0% |
| Welsh | 5.0 /100 | #231 | Tragic 22.0% |
| Immigrants | Thailand | 5.0 /100 | #232 | Tragic 22.0% |
| Spaniards | 4.7 /100 | #233 | Tragic 22.0% |
| Spanish | 4.7 /100 | #234 | Tragic 22.0% |
| Dutch | 4.6 /100 | #235 | Tragic 22.0% |
| Immigrants | Ecuador | 4.2 /100 | #236 | Tragic 22.0% |
| Vietnamese | 4.0 /100 | #237 | Tragic 22.0% |
| French Canadians | 2.8 /100 | #238 | Tragic 22.2% |
| Malaysians | 2.8 /100 | #239 | Tragic 22.2% |
| French | 2.3 /100 | #240 | Tragic 22.2% |
Demographics Similar to Immigrants from Congo by Single Female Poverty
In terms of single female poverty, the demographic groups most similar to Immigrants from Congo are Immigrants from Dominican Republic (25.3%, a difference of 0.010%), Immigrants from Mexico (25.3%, a difference of 0.11%), Somali (25.2%, a difference of 0.27%), Potawatomi (25.4%, a difference of 0.34%), and Aleut (25.4%, a difference of 0.50%).
| Demographics | Rating | Rank | Single Female Poverty |
| Immigrants | Central America | 0.0 /100 | #297 | Tragic 24.8% |
| Yaqui | 0.0 /100 | #298 | Tragic 24.9% |
| Mexicans | 0.0 /100 | #299 | Tragic 25.0% |
| Blackfeet | 0.0 /100 | #300 | Tragic 25.1% |
| Hondurans | 0.0 /100 | #301 | Tragic 25.1% |
| Shoshone | 0.0 /100 | #302 | Tragic 25.1% |
| Somalis | 0.0 /100 | #303 | Tragic 25.2% |
| Immigrants | Congo | 0.0 /100 | #304 | Tragic 25.3% |
| Immigrants | Dominican Republic | 0.0 /100 | #305 | Tragic 25.3% |
| Immigrants | Mexico | 0.0 /100 | #306 | Tragic 25.3% |
| Potawatomi | 0.0 /100 | #307 | Tragic 25.4% |
| Aleuts | 0.0 /100 | #308 | Tragic 25.4% |
| Dominicans | 0.0 /100 | #309 | Tragic 25.4% |
| Central American Indians | 0.0 /100 | #310 | Tragic 25.5% |
| Immigrants | Honduras | 0.0 /100 | #311 | Tragic 25.5% |