Yuman vs Czechoslovakian Male Poverty
COMPARE
Yuman
Czechoslovakian
Male Poverty
Male Poverty Comparison
Yuman
Czechoslovakians
19.5%
MALE POVERTY
0.0/ 100
METRIC RATING
339th/ 347
METRIC RANK
10.3%
MALE POVERTY
95.6/ 100
METRIC RATING
84th/ 347
METRIC RANK
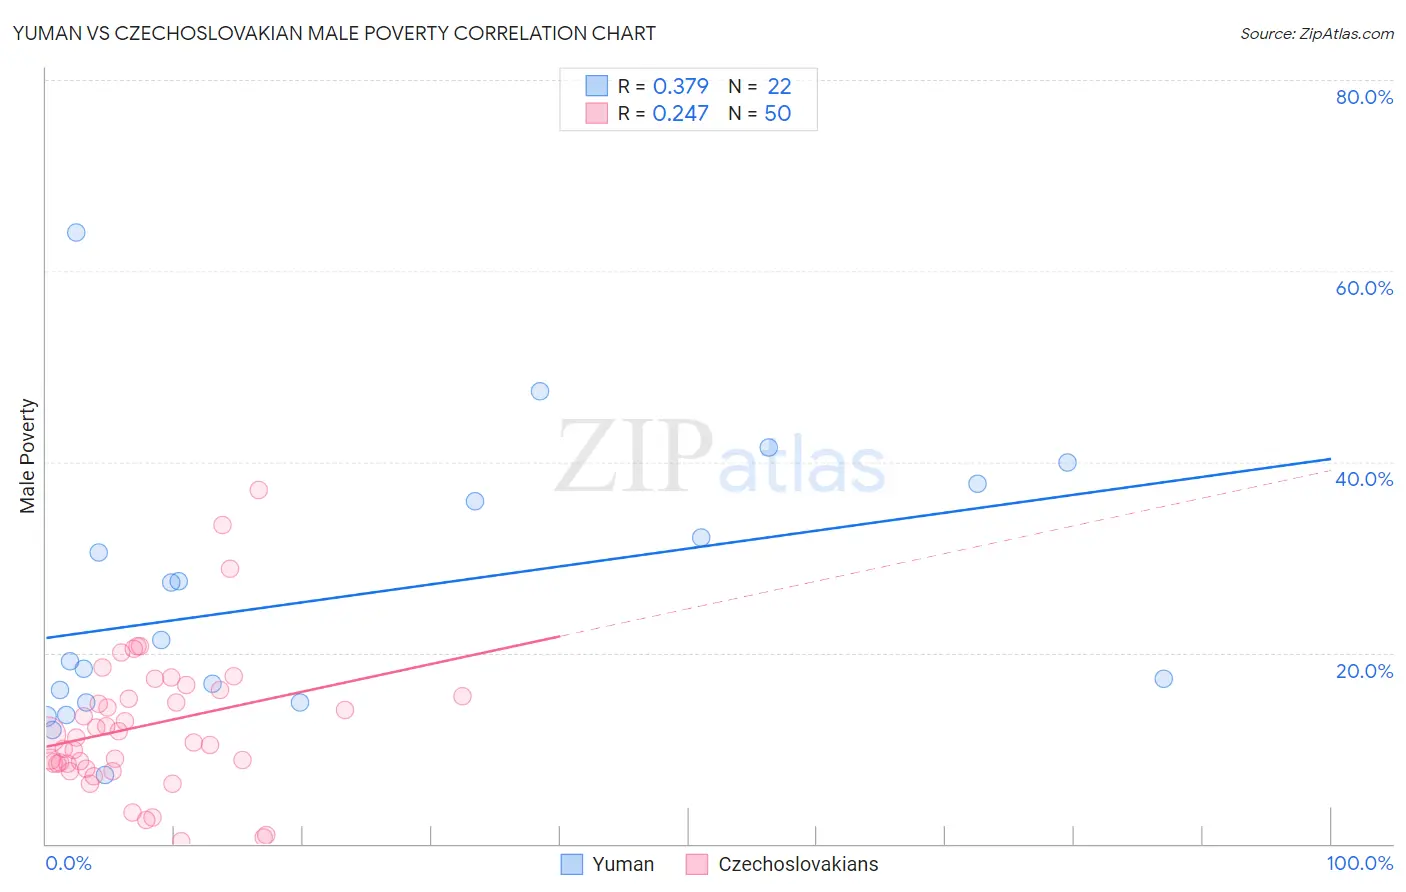
Yuman vs Czechoslovakian Male Poverty Correlation Chart
The statistical analysis conducted on geographies consisting of 40,667,603 people shows a mild positive correlation between the proportion of Yuman and poverty level among males in the United States with a correlation coefficient (R) of 0.379 and weighted average of 19.5%. Similarly, the statistical analysis conducted on geographies consisting of 368,409,681 people shows a weak positive correlation between the proportion of Czechoslovakians and poverty level among males in the United States with a correlation coefficient (R) of 0.247 and weighted average of 10.3%, a difference of 88.9%.
Male Poverty Correlation Summary
| Measurement | Yuman | Czechoslovakian |
| Minimum | 7.2% | 0.22% |
| Maximum | 64.1% | 37.0% |
| Range | 56.9% | 36.8% |
| Mean | 25.8% | 12.4% |
| Median | 20.2% | 11.3% |
| Interquartile 25% (IQ1) | 14.8% | 8.4% |
| Interquartile 75% (IQ3) | 35.9% | 16.1% |
| Interquartile Range (IQR) | 21.1% | 7.7% |
| Standard Deviation (Sample) | 14.1% | 7.5% |
| Standard Deviation (Population) | 13.7% | 7.4% |
Similar Demographics by Male Poverty
Demographics Similar to Yuman by Male Poverty
In terms of male poverty, the demographic groups most similar to Yuman are Crow (19.1%, a difference of 2.2%), Immigrants from Yemen (20.1%, a difference of 3.1%), Lumbee (20.2%, a difference of 3.4%), Pima (20.4%, a difference of 4.2%), and Yup'ik (20.4%, a difference of 4.3%).
| Demographics | Rating | Rank | Male Poverty |
| Houma | 0.0 /100 | #332 | Tragic 16.7% |
| Natives/Alaskans | 0.0 /100 | #333 | Tragic 16.9% |
| Cheyenne | 0.0 /100 | #334 | Tragic 17.6% |
| Apache | 0.0 /100 | #335 | Tragic 17.7% |
| Pueblo | 0.0 /100 | #336 | Tragic 18.5% |
| Sioux | 0.0 /100 | #337 | Tragic 18.7% |
| Crow | 0.0 /100 | #338 | Tragic 19.1% |
| Yuman | 0.0 /100 | #339 | Tragic 19.5% |
| Immigrants | Yemen | 0.0 /100 | #340 | Tragic 20.1% |
| Lumbee | 0.0 /100 | #341 | Tragic 20.2% |
| Pima | 0.0 /100 | #342 | Tragic 20.4% |
| Yup'ik | 0.0 /100 | #343 | Tragic 20.4% |
| Hopi | 0.0 /100 | #344 | Tragic 20.8% |
| Puerto Ricans | 0.0 /100 | #345 | Tragic 22.0% |
| Navajo | 0.0 /100 | #346 | Tragic 22.3% |
Demographics Similar to Czechoslovakians by Male Poverty
In terms of male poverty, the demographic groups most similar to Czechoslovakians are Immigrants from England (10.4%, a difference of 0.050%), Immigrants from Sweden (10.3%, a difference of 0.060%), Immigrants from Eastern Asia (10.4%, a difference of 0.18%), Belgian (10.3%, a difference of 0.19%), and Egyptian (10.3%, a difference of 0.19%).
| Demographics | Rating | Rank | Male Poverty |
| Immigrants | Belgium | 96.8 /100 | #77 | Exceptional 10.3% |
| Irish | 96.8 /100 | #78 | Exceptional 10.3% |
| Immigrants | North America | 96.5 /100 | #79 | Exceptional 10.3% |
| English | 96.4 /100 | #80 | Exceptional 10.3% |
| Belgians | 95.9 /100 | #81 | Exceptional 10.3% |
| Egyptians | 95.9 /100 | #82 | Exceptional 10.3% |
| Immigrants | Sweden | 95.7 /100 | #83 | Exceptional 10.3% |
| Czechoslovakians | 95.6 /100 | #84 | Exceptional 10.3% |
| Immigrants | England | 95.5 /100 | #85 | Exceptional 10.4% |
| Immigrants | Eastern Asia | 95.3 /100 | #86 | Exceptional 10.4% |
| Northern Europeans | 95.2 /100 | #87 | Exceptional 10.4% |
| Cambodians | 95.0 /100 | #88 | Exceptional 10.4% |
| Immigrants | Denmark | 95.0 /100 | #89 | Exceptional 10.4% |
| Indians (Asian) | 94.9 /100 | #90 | Exceptional 10.4% |
| British | 94.8 /100 | #91 | Exceptional 10.4% |