Norwegian vs Czechoslovakian Male Poverty
COMPARE
Norwegian
Czechoslovakian
Male Poverty
Male Poverty Comparison
Norwegians
Czechoslovakians
9.5%
MALE POVERTY
99.8/ 100
METRIC RATING
17th/ 347
METRIC RANK
10.3%
MALE POVERTY
95.6/ 100
METRIC RATING
84th/ 347
METRIC RANK
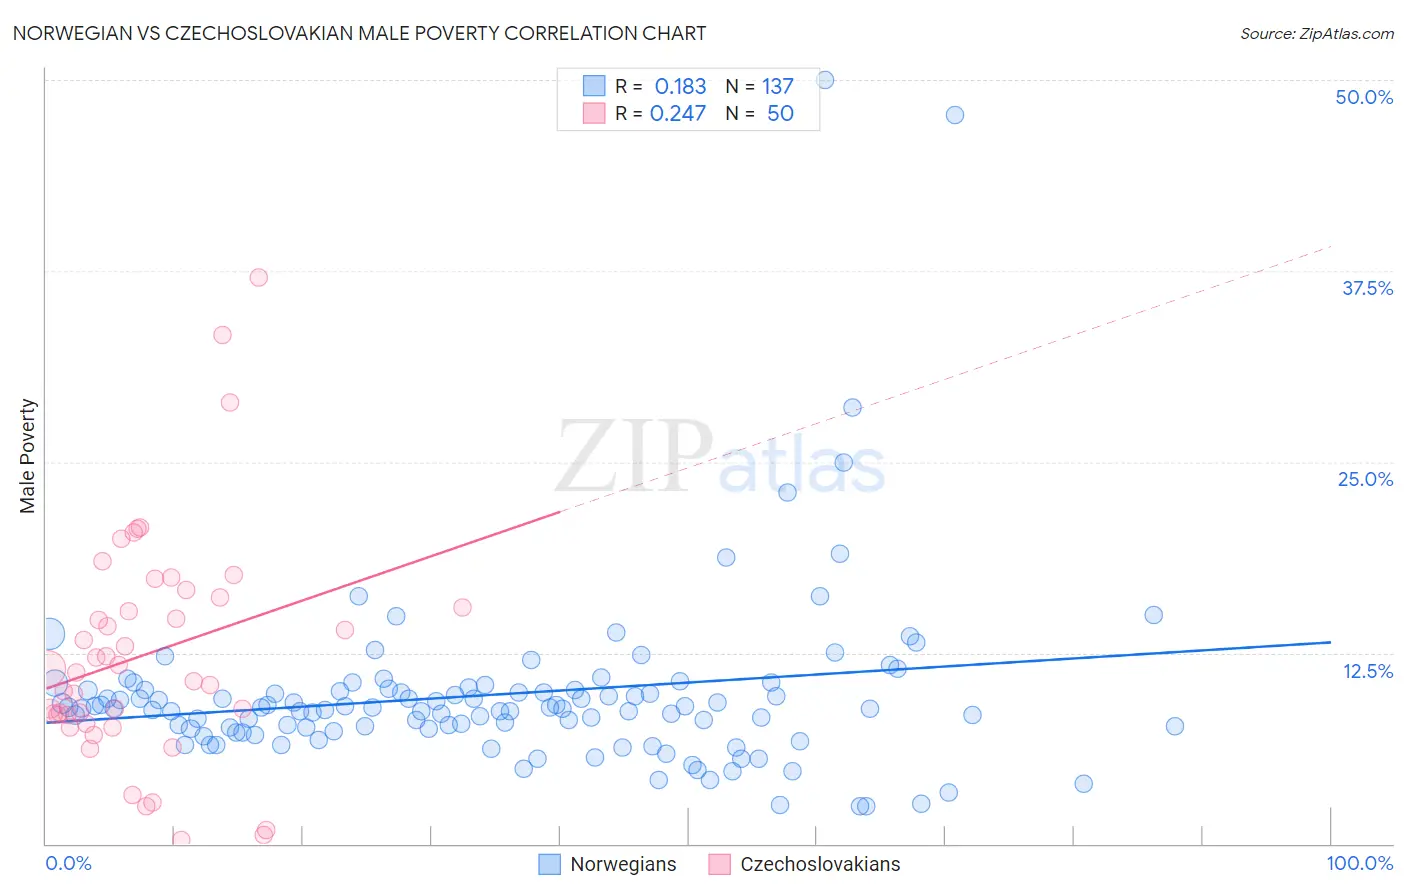
Norwegian vs Czechoslovakian Male Poverty Correlation Chart
The statistical analysis conducted on geographies consisting of 532,206,209 people shows a poor positive correlation between the proportion of Norwegians and poverty level among males in the United States with a correlation coefficient (R) of 0.183 and weighted average of 9.5%. Similarly, the statistical analysis conducted on geographies consisting of 368,409,681 people shows a weak positive correlation between the proportion of Czechoslovakians and poverty level among males in the United States with a correlation coefficient (R) of 0.247 and weighted average of 10.3%, a difference of 8.6%.
Male Poverty Correlation Summary
| Measurement | Norwegian | Czechoslovakian |
| Minimum | 2.4% | 0.22% |
| Maximum | 50.0% | 37.0% |
| Range | 47.6% | 36.8% |
| Mean | 9.8% | 12.4% |
| Median | 8.9% | 11.3% |
| Interquartile 25% (IQ1) | 7.5% | 8.4% |
| Interquartile 75% (IQ3) | 10.1% | 16.1% |
| Interquartile Range (IQR) | 2.5% | 7.7% |
| Standard Deviation (Sample) | 6.1% | 7.5% |
| Standard Deviation (Population) | 6.1% | 7.4% |
Similar Demographics by Male Poverty
Demographics Similar to Norwegians by Male Poverty
In terms of male poverty, the demographic groups most similar to Norwegians are Luxembourger (9.5%, a difference of 0.13%), Lithuanian (9.5%, a difference of 0.17%), Immigrants from Hong Kong (9.6%, a difference of 0.35%), Latvian (9.6%, a difference of 0.45%), and Bhutanese (9.5%, a difference of 0.65%).
| Demographics | Rating | Rank | Male Poverty |
| Bulgarians | 99.9 /100 | #10 | Exceptional 9.3% |
| Bolivians | 99.9 /100 | #11 | Exceptional 9.4% |
| Immigrants | Bolivia | 99.9 /100 | #12 | Exceptional 9.4% |
| Immigrants | Lithuania | 99.9 /100 | #13 | Exceptional 9.4% |
| Immigrants | North Macedonia | 99.8 /100 | #14 | Exceptional 9.4% |
| Bhutanese | 99.8 /100 | #15 | Exceptional 9.5% |
| Luxembourgers | 99.8 /100 | #16 | Exceptional 9.5% |
| Norwegians | 99.8 /100 | #17 | Exceptional 9.5% |
| Lithuanians | 99.8 /100 | #18 | Exceptional 9.5% |
| Immigrants | Hong Kong | 99.7 /100 | #19 | Exceptional 9.6% |
| Latvians | 99.7 /100 | #20 | Exceptional 9.6% |
| Immigrants | Scotland | 99.7 /100 | #21 | Exceptional 9.6% |
| Croatians | 99.7 /100 | #22 | Exceptional 9.6% |
| Italians | 99.7 /100 | #23 | Exceptional 9.6% |
| Swedes | 99.7 /100 | #24 | Exceptional 9.6% |
Demographics Similar to Czechoslovakians by Male Poverty
In terms of male poverty, the demographic groups most similar to Czechoslovakians are Immigrants from England (10.4%, a difference of 0.050%), Immigrants from Sweden (10.3%, a difference of 0.060%), Immigrants from Eastern Asia (10.4%, a difference of 0.18%), Belgian (10.3%, a difference of 0.19%), and Egyptian (10.3%, a difference of 0.19%).
| Demographics | Rating | Rank | Male Poverty |
| Immigrants | Belgium | 96.8 /100 | #77 | Exceptional 10.3% |
| Irish | 96.8 /100 | #78 | Exceptional 10.3% |
| Immigrants | North America | 96.5 /100 | #79 | Exceptional 10.3% |
| English | 96.4 /100 | #80 | Exceptional 10.3% |
| Belgians | 95.9 /100 | #81 | Exceptional 10.3% |
| Egyptians | 95.9 /100 | #82 | Exceptional 10.3% |
| Immigrants | Sweden | 95.7 /100 | #83 | Exceptional 10.3% |
| Czechoslovakians | 95.6 /100 | #84 | Exceptional 10.3% |
| Immigrants | England | 95.5 /100 | #85 | Exceptional 10.4% |
| Immigrants | Eastern Asia | 95.3 /100 | #86 | Exceptional 10.4% |
| Northern Europeans | 95.2 /100 | #87 | Exceptional 10.4% |
| Cambodians | 95.0 /100 | #88 | Exceptional 10.4% |
| Immigrants | Denmark | 95.0 /100 | #89 | Exceptional 10.4% |
| Indians (Asian) | 94.9 /100 | #90 | Exceptional 10.4% |
| British | 94.8 /100 | #91 | Exceptional 10.4% |