Yuman vs Czechoslovakian 8th Grade
COMPARE
Yuman
Czechoslovakian
8th Grade
8th Grade Comparison
Yuman
Czechoslovakians
94.9%
8TH GRADE
0.4/ 100
METRIC RATING
265th/ 347
METRIC RANK
96.9%
8TH GRADE
99.9/ 100
METRIC RATING
46th/ 347
METRIC RANK
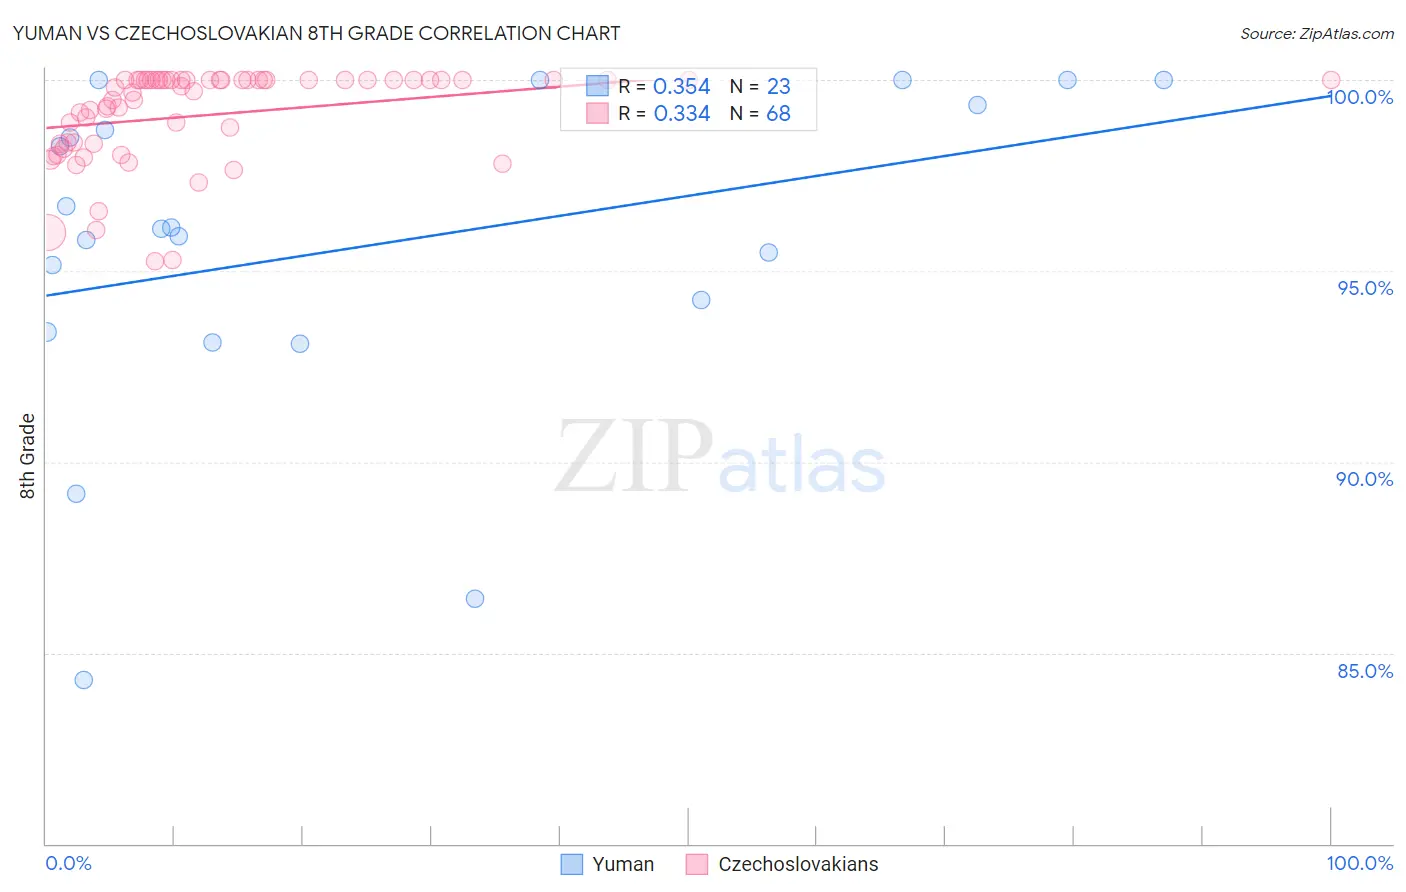
Yuman vs Czechoslovakian 8th Grade Correlation Chart
The statistical analysis conducted on geographies consisting of 40,696,349 people shows a mild positive correlation between the proportion of Yuman and percentage of population with at least 8th grade education in the United States with a correlation coefficient (R) of 0.354 and weighted average of 94.9%. Similarly, the statistical analysis conducted on geographies consisting of 368,657,544 people shows a mild positive correlation between the proportion of Czechoslovakians and percentage of population with at least 8th grade education in the United States with a correlation coefficient (R) of 0.334 and weighted average of 96.9%, a difference of 2.1%.
8th Grade Correlation Summary
| Measurement | Yuman | Czechoslovakian |
| Minimum | 84.3% | 95.3% |
| Maximum | 100.0% | 100.0% |
| Range | 15.7% | 4.7% |
| Mean | 95.6% | 99.1% |
| Median | 96.1% | 99.8% |
| Interquartile 25% (IQ1) | 93.4% | 98.3% |
| Interquartile 75% (IQ3) | 99.3% | 100.0% |
| Interquartile Range (IQR) | 5.9% | 1.7% |
| Standard Deviation (Sample) | 4.3% | 1.2% |
| Standard Deviation (Population) | 4.2% | 1.2% |
Similar Demographics by 8th Grade
Demographics Similar to Yuman by 8th Grade
In terms of 8th grade, the demographic groups most similar to Yuman are South American (94.9%, a difference of 0.0%), Immigrants from Nigeria (94.9%, a difference of 0.010%), Immigrants from Hong Kong (94.9%, a difference of 0.010%), Immigrants from Costa Rica (94.9%, a difference of 0.030%), and West Indian (94.8%, a difference of 0.040%).
| Demographics | Rating | Rank | 8th Grade |
| Immigrants | Congo | 0.6 /100 | #258 | Tragic 94.9% |
| Ghanaians | 0.6 /100 | #259 | Tragic 94.9% |
| Immigrants | Jamaica | 0.6 /100 | #260 | Tragic 94.9% |
| Immigrants | Costa Rica | 0.5 /100 | #261 | Tragic 94.9% |
| Immigrants | Nigeria | 0.4 /100 | #262 | Tragic 94.9% |
| Immigrants | Hong Kong | 0.4 /100 | #263 | Tragic 94.9% |
| South Americans | 0.4 /100 | #264 | Tragic 94.9% |
| Yuman | 0.4 /100 | #265 | Tragic 94.9% |
| West Indians | 0.3 /100 | #266 | Tragic 94.8% |
| Immigrants | Ghana | 0.3 /100 | #267 | Tragic 94.8% |
| Immigrants | Uruguay | 0.3 /100 | #268 | Tragic 94.8% |
| Immigrants | Thailand | 0.2 /100 | #269 | Tragic 94.8% |
| Immigrants | Uzbekistan | 0.2 /100 | #270 | Tragic 94.8% |
| Immigrants | Afghanistan | 0.2 /100 | #271 | Tragic 94.8% |
| Immigrants | South America | 0.2 /100 | #272 | Tragic 94.8% |
Demographics Similar to Czechoslovakians by 8th Grade
In terms of 8th grade, the demographic groups most similar to Czechoslovakians are Maltese (96.9%, a difference of 0.010%), Northern European (96.9%, a difference of 0.010%), Bulgarian (96.9%, a difference of 0.010%), Aleut (96.9%, a difference of 0.030%), and Slavic (96.8%, a difference of 0.040%).
| Demographics | Rating | Rank | 8th Grade |
| Hungarians | 100.0 /100 | #39 | Exceptional 97.0% |
| Inupiat | 100.0 /100 | #40 | Exceptional 97.0% |
| Eastern Europeans | 100.0 /100 | #41 | Exceptional 97.0% |
| Chinese | 100.0 /100 | #42 | Exceptional 96.9% |
| Aleuts | 99.9 /100 | #43 | Exceptional 96.9% |
| Maltese | 99.9 /100 | #44 | Exceptional 96.9% |
| Northern Europeans | 99.9 /100 | #45 | Exceptional 96.9% |
| Czechoslovakians | 99.9 /100 | #46 | Exceptional 96.9% |
| Bulgarians | 99.9 /100 | #47 | Exceptional 96.9% |
| Slavs | 99.9 /100 | #48 | Exceptional 96.8% |
| Estonians | 99.9 /100 | #49 | Exceptional 96.8% |
| Immigrants | Scotland | 99.9 /100 | #50 | Exceptional 96.8% |
| Celtics | 99.9 /100 | #51 | Exceptional 96.8% |
| Greeks | 99.9 /100 | #52 | Exceptional 96.8% |
| Austrians | 99.9 /100 | #53 | Exceptional 96.7% |