Yuman vs Croatian Male Poverty
COMPARE
Yuman
Croatian
Male Poverty
Male Poverty Comparison
Yuman
Croatians
19.5%
MALE POVERTY
0.0/ 100
METRIC RATING
339th/ 347
METRIC RANK
9.6%
MALE POVERTY
99.7/ 100
METRIC RATING
22nd/ 347
METRIC RANK
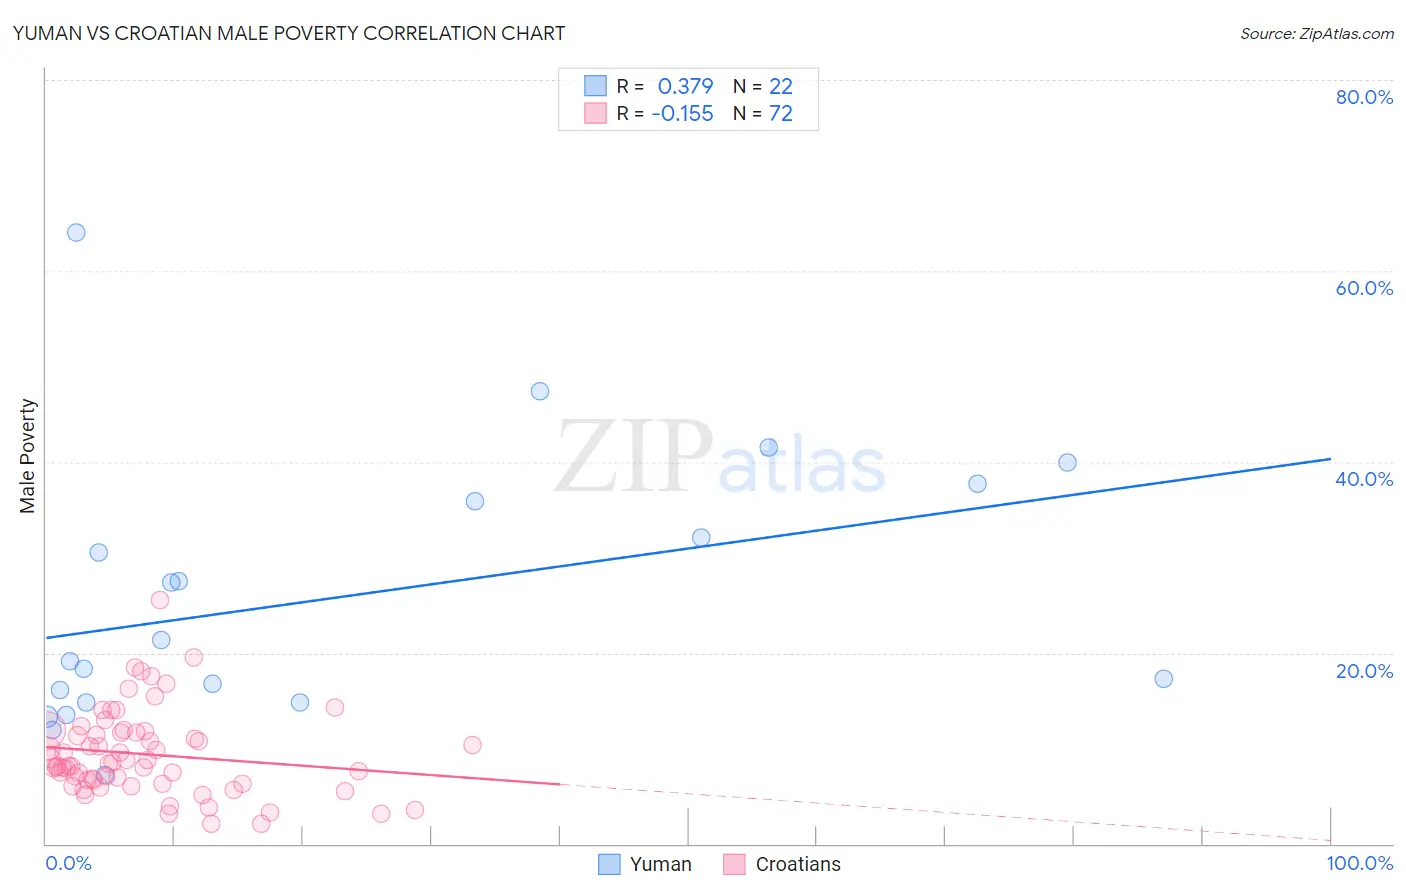
Yuman vs Croatian Male Poverty Correlation Chart
The statistical analysis conducted on geographies consisting of 40,667,603 people shows a mild positive correlation between the proportion of Yuman and poverty level among males in the United States with a correlation coefficient (R) of 0.379 and weighted average of 19.5%. Similarly, the statistical analysis conducted on geographies consisting of 375,378,387 people shows a poor negative correlation between the proportion of Croatians and poverty level among males in the United States with a correlation coefficient (R) of -0.155 and weighted average of 9.6%, a difference of 103.2%.
Male Poverty Correlation Summary
| Measurement | Yuman | Croatian |
| Minimum | 7.2% | 2.1% |
| Maximum | 64.1% | 25.5% |
| Range | 56.9% | 23.4% |
| Mean | 25.8% | 9.4% |
| Median | 20.2% | 8.2% |
| Interquartile 25% (IQ1) | 14.8% | 6.5% |
| Interquartile 75% (IQ3) | 35.9% | 11.6% |
| Interquartile Range (IQR) | 21.1% | 5.2% |
| Standard Deviation (Sample) | 14.1% | 4.4% |
| Standard Deviation (Population) | 13.7% | 4.4% |
Similar Demographics by Male Poverty
Demographics Similar to Yuman by Male Poverty
In terms of male poverty, the demographic groups most similar to Yuman are Crow (19.1%, a difference of 2.2%), Immigrants from Yemen (20.1%, a difference of 3.1%), Lumbee (20.2%, a difference of 3.4%), Pima (20.4%, a difference of 4.2%), and Yup'ik (20.4%, a difference of 4.3%).
| Demographics | Rating | Rank | Male Poverty |
| Houma | 0.0 /100 | #332 | Tragic 16.7% |
| Natives/Alaskans | 0.0 /100 | #333 | Tragic 16.9% |
| Cheyenne | 0.0 /100 | #334 | Tragic 17.6% |
| Apache | 0.0 /100 | #335 | Tragic 17.7% |
| Pueblo | 0.0 /100 | #336 | Tragic 18.5% |
| Sioux | 0.0 /100 | #337 | Tragic 18.7% |
| Crow | 0.0 /100 | #338 | Tragic 19.1% |
| Yuman | 0.0 /100 | #339 | Tragic 19.5% |
| Immigrants | Yemen | 0.0 /100 | #340 | Tragic 20.1% |
| Lumbee | 0.0 /100 | #341 | Tragic 20.2% |
| Pima | 0.0 /100 | #342 | Tragic 20.4% |
| Yup'ik | 0.0 /100 | #343 | Tragic 20.4% |
| Hopi | 0.0 /100 | #344 | Tragic 20.8% |
| Puerto Ricans | 0.0 /100 | #345 | Tragic 22.0% |
| Navajo | 0.0 /100 | #346 | Tragic 22.3% |
Demographics Similar to Croatians by Male Poverty
In terms of male poverty, the demographic groups most similar to Croatians are Italian (9.6%, a difference of 0.010%), Swedish (9.6%, a difference of 0.090%), Eastern European (9.6%, a difference of 0.23%), Immigrants from Scotland (9.6%, a difference of 0.25%), and Latvian (9.6%, a difference of 0.51%).
| Demographics | Rating | Rank | Male Poverty |
| Bhutanese | 99.8 /100 | #15 | Exceptional 9.5% |
| Luxembourgers | 99.8 /100 | #16 | Exceptional 9.5% |
| Norwegians | 99.8 /100 | #17 | Exceptional 9.5% |
| Lithuanians | 99.8 /100 | #18 | Exceptional 9.5% |
| Immigrants | Hong Kong | 99.7 /100 | #19 | Exceptional 9.6% |
| Latvians | 99.7 /100 | #20 | Exceptional 9.6% |
| Immigrants | Scotland | 99.7 /100 | #21 | Exceptional 9.6% |
| Croatians | 99.7 /100 | #22 | Exceptional 9.6% |
| Italians | 99.7 /100 | #23 | Exceptional 9.6% |
| Swedes | 99.7 /100 | #24 | Exceptional 9.6% |
| Eastern Europeans | 99.6 /100 | #25 | Exceptional 9.6% |
| Burmese | 99.6 /100 | #26 | Exceptional 9.7% |
| Danes | 99.6 /100 | #27 | Exceptional 9.7% |
| Immigrants | Korea | 99.6 /100 | #28 | Exceptional 9.7% |
| Greeks | 99.6 /100 | #29 | Exceptional 9.7% |