Yuman vs Vietnamese Male Poverty
COMPARE
Yuman
Vietnamese
Male Poverty
Male Poverty Comparison
Yuman
Vietnamese
19.5%
MALE POVERTY
0.0/ 100
METRIC RATING
339th/ 347
METRIC RANK
13.8%
MALE POVERTY
0.0/ 100
METRIC RATING
291st/ 347
METRIC RANK
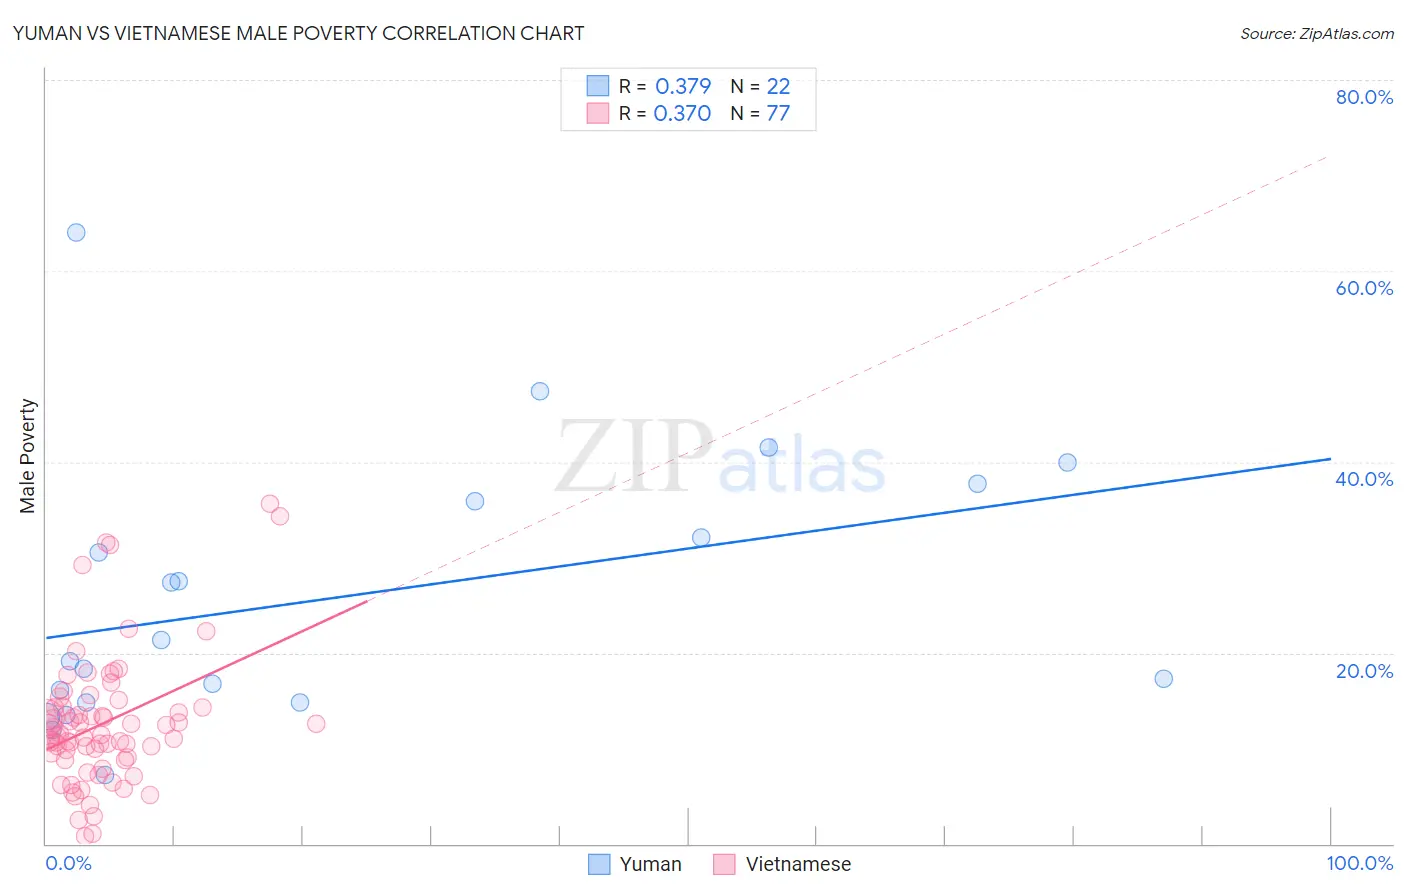
Yuman vs Vietnamese Male Poverty Correlation Chart
The statistical analysis conducted on geographies consisting of 40,667,603 people shows a mild positive correlation between the proportion of Yuman and poverty level among males in the United States with a correlation coefficient (R) of 0.379 and weighted average of 19.5%. Similarly, the statistical analysis conducted on geographies consisting of 170,649,781 people shows a mild positive correlation between the proportion of Vietnamese and poverty level among males in the United States with a correlation coefficient (R) of 0.370 and weighted average of 13.8%, a difference of 41.4%.
Male Poverty Correlation Summary
| Measurement | Yuman | Vietnamese |
| Minimum | 7.2% | 0.78% |
| Maximum | 64.1% | 35.7% |
| Range | 56.9% | 34.9% |
| Mean | 25.8% | 12.6% |
| Median | 20.2% | 11.4% |
| Interquartile 25% (IQ1) | 14.8% | 8.9% |
| Interquartile 75% (IQ3) | 35.9% | 14.3% |
| Interquartile Range (IQR) | 21.1% | 5.4% |
| Standard Deviation (Sample) | 14.1% | 6.9% |
| Standard Deviation (Population) | 13.7% | 6.8% |
Similar Demographics by Male Poverty
Demographics Similar to Yuman by Male Poverty
In terms of male poverty, the demographic groups most similar to Yuman are Crow (19.1%, a difference of 2.2%), Immigrants from Yemen (20.1%, a difference of 3.1%), Lumbee (20.2%, a difference of 3.4%), Pima (20.4%, a difference of 4.2%), and Yup'ik (20.4%, a difference of 4.3%).
| Demographics | Rating | Rank | Male Poverty |
| Houma | 0.0 /100 | #332 | Tragic 16.7% |
| Natives/Alaskans | 0.0 /100 | #333 | Tragic 16.9% |
| Cheyenne | 0.0 /100 | #334 | Tragic 17.6% |
| Apache | 0.0 /100 | #335 | Tragic 17.7% |
| Pueblo | 0.0 /100 | #336 | Tragic 18.5% |
| Sioux | 0.0 /100 | #337 | Tragic 18.7% |
| Crow | 0.0 /100 | #338 | Tragic 19.1% |
| Yuman | 0.0 /100 | #339 | Tragic 19.5% |
| Immigrants | Yemen | 0.0 /100 | #340 | Tragic 20.1% |
| Lumbee | 0.0 /100 | #341 | Tragic 20.2% |
| Pima | 0.0 /100 | #342 | Tragic 20.4% |
| Yup'ik | 0.0 /100 | #343 | Tragic 20.4% |
| Hopi | 0.0 /100 | #344 | Tragic 20.8% |
| Puerto Ricans | 0.0 /100 | #345 | Tragic 22.0% |
| Navajo | 0.0 /100 | #346 | Tragic 22.3% |
Demographics Similar to Vietnamese by Male Poverty
In terms of male poverty, the demographic groups most similar to Vietnamese are Immigrants from Zaire (13.8%, a difference of 0.090%), Guatemalan (13.8%, a difference of 0.10%), Indonesian (13.8%, a difference of 0.17%), Immigrants from Belize (13.8%, a difference of 0.18%), and Hispanic or Latino (13.9%, a difference of 0.24%).
| Demographics | Rating | Rank | Male Poverty |
| Immigrants | Haiti | 0.0 /100 | #284 | Tragic 13.8% |
| West Indians | 0.0 /100 | #285 | Tragic 13.8% |
| Shoshone | 0.0 /100 | #286 | Tragic 13.8% |
| Immigrants | Barbados | 0.0 /100 | #287 | Tragic 13.8% |
| Immigrants | St. Vincent and the Grenadines | 0.0 /100 | #288 | Tragic 13.8% |
| Guatemalans | 0.0 /100 | #289 | Tragic 13.8% |
| Immigrants | Zaire | 0.0 /100 | #290 | Tragic 13.8% |
| Vietnamese | 0.0 /100 | #291 | Tragic 13.8% |
| Indonesians | 0.0 /100 | #292 | Tragic 13.8% |
| Immigrants | Belize | 0.0 /100 | #293 | Tragic 13.8% |
| Hispanics or Latinos | 0.0 /100 | #294 | Tragic 13.9% |
| Immigrants | Central America | 0.0 /100 | #295 | Tragic 13.9% |
| Cajuns | 0.0 /100 | #296 | Tragic 13.9% |
| Inupiat | 0.0 /100 | #297 | Tragic 14.0% |
| Blackfeet | 0.0 /100 | #298 | Tragic 14.0% |