Yakama vs Immigrants from Grenada College, 1 year or more
COMPARE
Yakama
Immigrants from Grenada
College, 1 year or more
College, 1 year or more Comparison
Yakama
Immigrants from Grenada
46.2%
COLLEGE, 1 YEAR OR MORE
0.0/ 100
METRIC RATING
344th/ 347
METRIC RANK
54.4%
COLLEGE, 1 YEAR OR MORE
0.2/ 100
METRIC RATING
273rd/ 347
METRIC RANK
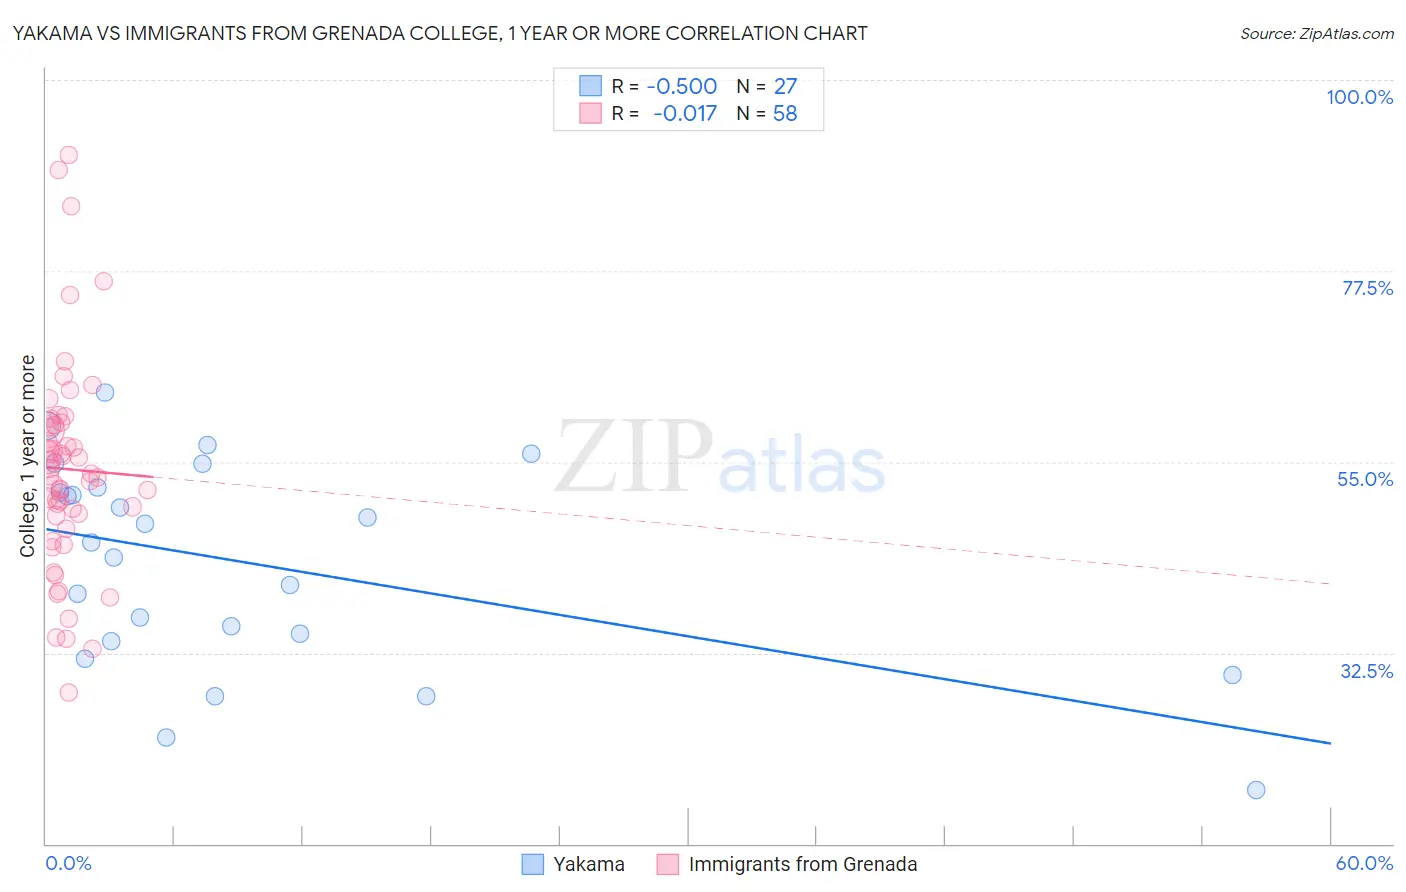
Yakama vs Immigrants from Grenada College, 1 year or more Correlation Chart
The statistical analysis conducted on geographies consisting of 19,923,144 people shows a moderate negative correlation between the proportion of Yakama and percentage of population with at least college, 1 year or more education in the United States with a correlation coefficient (R) of -0.500 and weighted average of 46.2%. Similarly, the statistical analysis conducted on geographies consisting of 67,201,096 people shows no correlation between the proportion of Immigrants from Grenada and percentage of population with at least college, 1 year or more education in the United States with a correlation coefficient (R) of -0.017 and weighted average of 54.4%, a difference of 17.8%.
College, 1 year or more Correlation Summary
| Measurement | Yakama | Immigrants from Grenada |
| Minimum | 16.3% | 27.9% |
| Maximum | 63.1% | 91.1% |
| Range | 46.8% | 63.3% |
| Mean | 43.0% | 54.1% |
| Median | 45.5% | 53.4% |
| Interquartile 25% (IQ1) | 33.9% | 48.7% |
| Interquartile 75% (IQ3) | 52.0% | 59.3% |
| Interquartile Range (IQR) | 18.1% | 10.6% |
| Standard Deviation (Sample) | 12.2% | 12.5% |
| Standard Deviation (Population) | 12.0% | 12.4% |
Similar Demographics by College, 1 year or more
Demographics Similar to Yakama by College, 1 year or more
In terms of college, 1 year or more, the demographic groups most similar to Yakama are Pima (45.6%, a difference of 1.3%), Tohono O'odham (47.1%, a difference of 2.0%), Inupiat (47.2%, a difference of 2.2%), Immigrants from Mexico (47.5%, a difference of 2.8%), and Immigrants from Cabo Verde (48.1%, a difference of 4.0%).
| Demographics | Rating | Rank | College, 1 year or more |
| Immigrants | Dominican Republic | 0.0 /100 | #333 | Tragic 49.1% |
| Lumbee | 0.0 /100 | #334 | Tragic 48.9% |
| Yuman | 0.0 /100 | #335 | Tragic 48.7% |
| Spanish American Indians | 0.0 /100 | #336 | Tragic 48.5% |
| Pennsylvania Germans | 0.0 /100 | #337 | Tragic 48.5% |
| Immigrants | Central America | 0.0 /100 | #338 | Tragic 48.5% |
| Immigrants | Azores | 0.0 /100 | #339 | Tragic 48.4% |
| Immigrants | Cabo Verde | 0.0 /100 | #340 | Tragic 48.1% |
| Immigrants | Mexico | 0.0 /100 | #341 | Tragic 47.5% |
| Inupiat | 0.0 /100 | #342 | Tragic 47.2% |
| Tohono O'odham | 0.0 /100 | #343 | Tragic 47.1% |
| Yakama | 0.0 /100 | #344 | Tragic 46.2% |
| Pima | 0.0 /100 | #345 | Tragic 45.6% |
| Houma | 0.0 /100 | #346 | Tragic 41.2% |
| Yup'ik | 0.0 /100 | #347 | Tragic 39.4% |
Demographics Similar to Immigrants from Grenada by College, 1 year or more
In terms of college, 1 year or more, the demographic groups most similar to Immigrants from Grenada are Comanche (54.4%, a difference of 0.040%), Belizean (54.4%, a difference of 0.040%), American (54.4%, a difference of 0.060%), Bahamian (54.5%, a difference of 0.080%), and Crow (54.5%, a difference of 0.11%).
| Demographics | Rating | Rank | College, 1 year or more |
| Potawatomi | 0.2 /100 | #266 | Tragic 54.6% |
| Blackfeet | 0.2 /100 | #267 | Tragic 54.6% |
| British West Indians | 0.2 /100 | #268 | Tragic 54.5% |
| Bangladeshis | 0.2 /100 | #269 | Tragic 54.5% |
| Crow | 0.2 /100 | #270 | Tragic 54.5% |
| Bahamians | 0.2 /100 | #271 | Tragic 54.5% |
| Comanche | 0.2 /100 | #272 | Tragic 54.4% |
| Immigrants | Grenada | 0.2 /100 | #273 | Tragic 54.4% |
| Belizeans | 0.2 /100 | #274 | Tragic 54.4% |
| Americans | 0.2 /100 | #275 | Tragic 54.4% |
| Shoshone | 0.2 /100 | #276 | Tragic 54.3% |
| Ecuadorians | 0.2 /100 | #277 | Tragic 54.3% |
| Immigrants | Jamaica | 0.1 /100 | #278 | Tragic 54.2% |
| Arapaho | 0.1 /100 | #279 | Tragic 54.1% |
| Cheyenne | 0.1 /100 | #280 | Tragic 54.1% |