Yakama vs Immigrants from Grenada 1st Grade
COMPARE
Yakama
Immigrants from Grenada
1st Grade
1st Grade Comparison
Yakama
Immigrants from Grenada
96.5%
1ST GRADE
0.0/ 100
METRIC RATING
335th/ 347
METRIC RANK
97.2%
1ST GRADE
0.0/ 100
METRIC RATING
294th/ 347
METRIC RANK
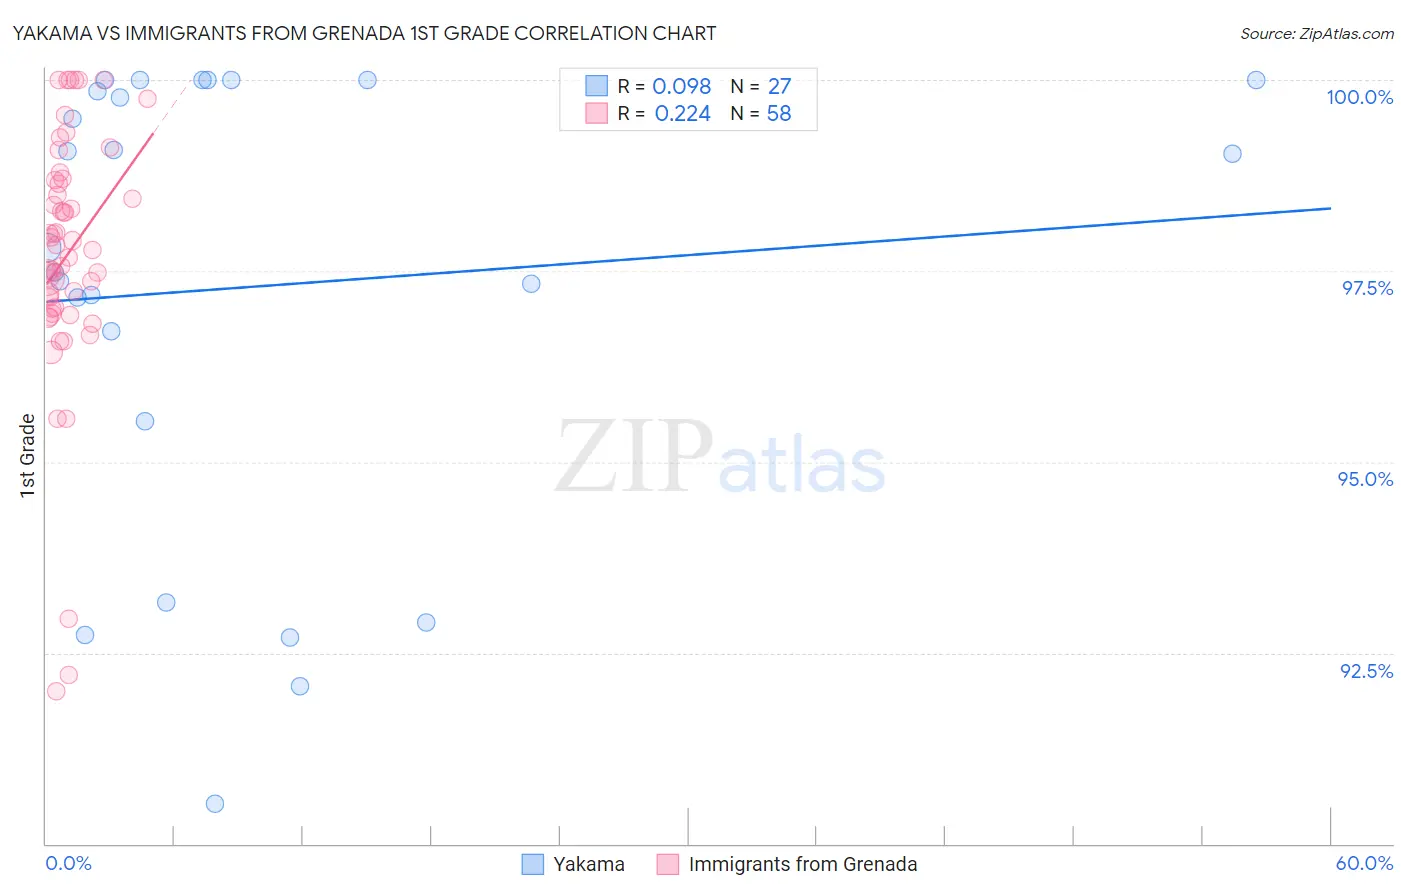
Yakama vs Immigrants from Grenada 1st Grade Correlation Chart
The statistical analysis conducted on geographies consisting of 19,923,144 people shows a slight positive correlation between the proportion of Yakama and percentage of population with at least 1st grade education in the United States with a correlation coefficient (R) of 0.098 and weighted average of 96.5%. Similarly, the statistical analysis conducted on geographies consisting of 67,200,336 people shows a weak positive correlation between the proportion of Immigrants from Grenada and percentage of population with at least 1st grade education in the United States with a correlation coefficient (R) of 0.224 and weighted average of 97.2%, a difference of 0.69%.
1st Grade Correlation Summary
| Measurement | Yakama | Immigrants from Grenada |
| Minimum | 90.5% | 92.0% |
| Maximum | 100.0% | 100.0% |
| Range | 9.5% | 8.0% |
| Mean | 97.3% | 97.7% |
| Median | 97.8% | 97.8% |
| Interquartile 25% (IQ1) | 95.5% | 97.0% |
| Interquartile 75% (IQ3) | 100.0% | 98.7% |
| Interquartile Range (IQR) | 4.5% | 1.7% |
| Standard Deviation (Sample) | 3.0% | 1.7% |
| Standard Deviation (Population) | 2.9% | 1.7% |
Similar Demographics by 1st Grade
Demographics Similar to Yakama by 1st Grade
In terms of 1st grade, the demographic groups most similar to Yakama are Immigrants from Dominican Republic (96.5%, a difference of 0.020%), Bangladeshi (96.5%, a difference of 0.020%), Guatemalan (96.5%, a difference of 0.020%), Central American (96.5%, a difference of 0.040%), and Immigrants from Cambodia (96.5%, a difference of 0.060%).
| Demographics | Rating | Rank | 1st Grade |
| Immigrants | Latin America | 0.0 /100 | #328 | Tragic 96.7% |
| Japanese | 0.0 /100 | #329 | Tragic 96.6% |
| Immigrants | Vietnam | 0.0 /100 | #330 | Tragic 96.6% |
| Immigrants | Armenia | 0.0 /100 | #331 | Tragic 96.6% |
| Central Americans | 0.0 /100 | #332 | Tragic 96.5% |
| Immigrants | Dominican Republic | 0.0 /100 | #333 | Tragic 96.5% |
| Bangladeshis | 0.0 /100 | #334 | Tragic 96.5% |
| Yakama | 0.0 /100 | #335 | Tragic 96.5% |
| Guatemalans | 0.0 /100 | #336 | Tragic 96.5% |
| Immigrants | Cambodia | 0.0 /100 | #337 | Tragic 96.5% |
| Immigrants | Fiji | 0.0 /100 | #338 | Tragic 96.4% |
| Immigrants | Guatemala | 0.0 /100 | #339 | Tragic 96.4% |
| Immigrants | Cabo Verde | 0.0 /100 | #340 | Tragic 96.3% |
| Immigrants | Central America | 0.0 /100 | #341 | Tragic 96.3% |
| Immigrants | Mexico | 0.0 /100 | #342 | Tragic 96.3% |
Demographics Similar to Immigrants from Grenada by 1st Grade
In terms of 1st grade, the demographic groups most similar to Immigrants from Grenada are Immigrants (97.2%, a difference of 0.010%), Immigrants from Eritrea (97.2%, a difference of 0.010%), Malaysian (97.2%, a difference of 0.020%), British West Indian (97.2%, a difference of 0.040%), and Houma (97.2%, a difference of 0.060%).
| Demographics | Rating | Rank | 1st Grade |
| Immigrants | Hong Kong | 0.0 /100 | #287 | Tragic 97.3% |
| Immigrants | Thailand | 0.0 /100 | #288 | Tragic 97.3% |
| Immigrants | Afghanistan | 0.0 /100 | #289 | Tragic 97.3% |
| Immigrants | St. Vincent and the Grenadines | 0.0 /100 | #290 | Tragic 97.3% |
| Houma | 0.0 /100 | #291 | Tragic 97.2% |
| British West Indians | 0.0 /100 | #292 | Tragic 97.2% |
| Malaysians | 0.0 /100 | #293 | Tragic 97.2% |
| Immigrants | Grenada | 0.0 /100 | #294 | Tragic 97.2% |
| Immigrants | Immigrants | 0.0 /100 | #295 | Tragic 97.2% |
| Immigrants | Eritrea | 0.0 /100 | #296 | Tragic 97.2% |
| Central American Indians | 0.0 /100 | #297 | Tragic 97.1% |
| Immigrants | Dominica | 0.0 /100 | #298 | Tragic 97.1% |
| Immigrants | Cuba | 0.0 /100 | #299 | Tragic 97.1% |
| Haitians | 0.0 /100 | #300 | Tragic 97.1% |
| Immigrants | South Eastern Asia | 0.0 /100 | #301 | Tragic 97.1% |