South American vs Immigrants from Grenada Single Female Poverty
COMPARE
South American
Immigrants from Grenada
Single Female Poverty
Single Female Poverty Comparison
South Americans
Immigrants from Grenada
20.0%
SINGLE FEMALE POVERTY
95.1/ 100
METRIC RATING
120th/ 347
METRIC RANK
21.8%
SINGLE FEMALE POVERTY
8.0/ 100
METRIC RATING
221st/ 347
METRIC RANK
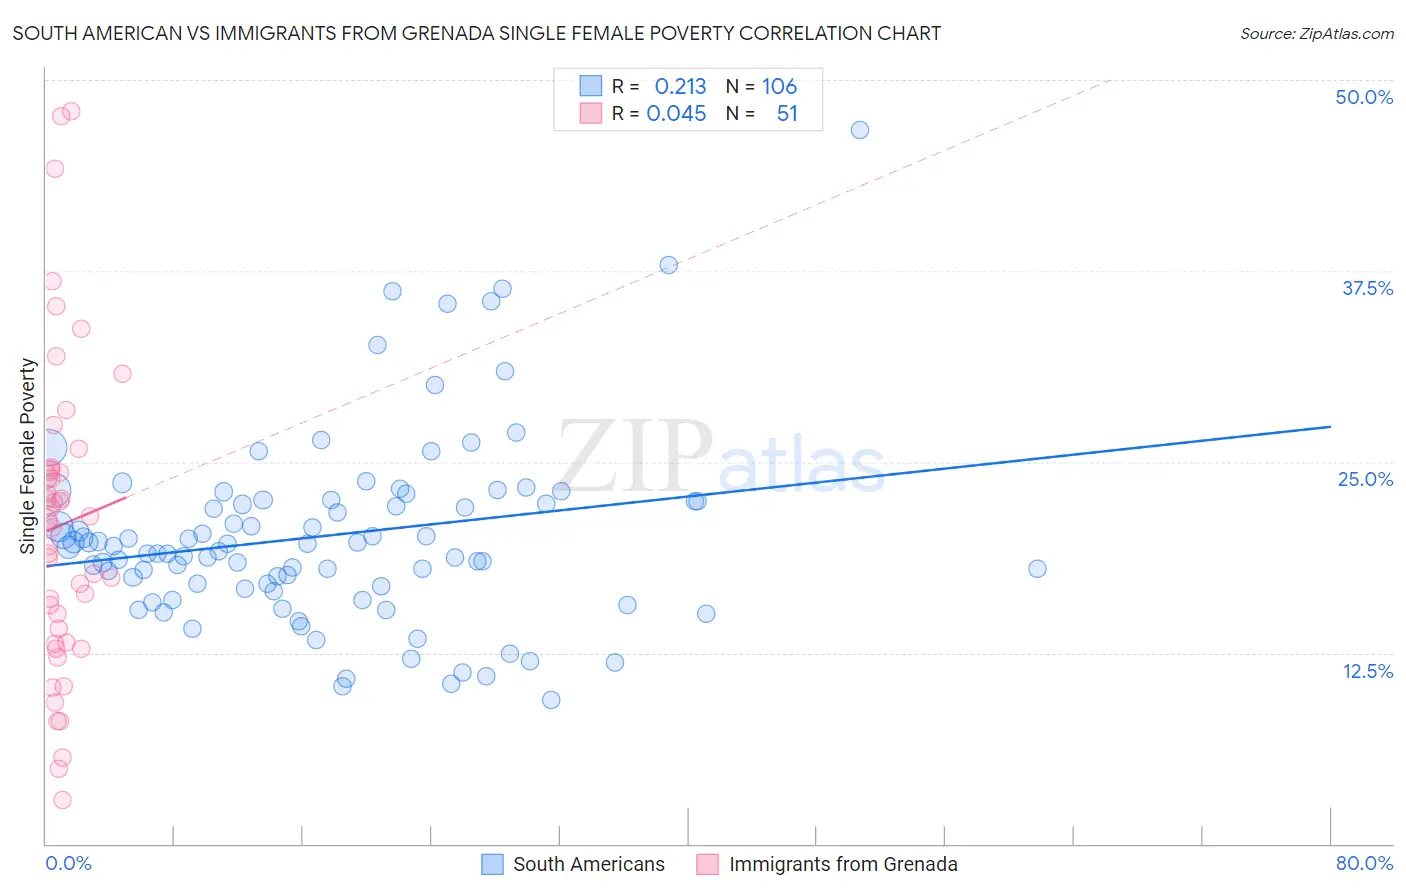
South American vs Immigrants from Grenada Single Female Poverty Correlation Chart
The statistical analysis conducted on geographies consisting of 482,993,980 people shows a weak positive correlation between the proportion of South Americans and poverty level among single females in the United States with a correlation coefficient (R) of 0.213 and weighted average of 20.0%. Similarly, the statistical analysis conducted on geographies consisting of 66,935,343 people shows no correlation between the proportion of Immigrants from Grenada and poverty level among single females in the United States with a correlation coefficient (R) of 0.045 and weighted average of 21.8%, a difference of 8.8%.
Single Female Poverty Correlation Summary
| Measurement | South American | Immigrants from Grenada |
| Minimum | 9.4% | 2.9% |
| Maximum | 46.7% | 47.9% |
| Range | 37.3% | 45.1% |
| Mean | 20.2% | 20.9% |
| Median | 19.5% | 21.0% |
| Interquartile 25% (IQ1) | 16.9% | 13.2% |
| Interquartile 75% (IQ3) | 22.4% | 24.4% |
| Interquartile Range (IQR) | 5.5% | 11.3% |
| Standard Deviation (Sample) | 6.2% | 10.1% |
| Standard Deviation (Population) | 6.2% | 10.0% |
Similar Demographics by Single Female Poverty
Demographics Similar to South Americans by Single Female Poverty
In terms of single female poverty, the demographic groups most similar to South Americans are Immigrants from Switzerland (20.0%, a difference of 0.030%), Immigrants from South America (20.0%, a difference of 0.060%), Immigrants from Afghanistan (20.0%, a difference of 0.10%), Immigrants from Ethiopia (20.0%, a difference of 0.10%), and Polish (20.0%, a difference of 0.17%).
| Demographics | Rating | Rank | Single Female Poverty |
| Immigrants | Zimbabwe | 95.9 /100 | #113 | Exceptional 20.0% |
| Immigrants | Colombia | 95.9 /100 | #114 | Exceptional 20.0% |
| Immigrants | Northern Africa | 95.8 /100 | #115 | Exceptional 20.0% |
| Immigrants | Kazakhstan | 95.7 /100 | #116 | Exceptional 20.0% |
| Poles | 95.6 /100 | #117 | Exceptional 20.0% |
| Immigrants | Afghanistan | 95.4 /100 | #118 | Exceptional 20.0% |
| Immigrants | Ethiopia | 95.4 /100 | #119 | Exceptional 20.0% |
| South Americans | 95.1 /100 | #120 | Exceptional 20.0% |
| Immigrants | Switzerland | 95.1 /100 | #121 | Exceptional 20.0% |
| Immigrants | South America | 95.0 /100 | #122 | Exceptional 20.0% |
| Brazilians | 94.4 /100 | #123 | Exceptional 20.1% |
| Immigrants | Chile | 94.3 /100 | #124 | Exceptional 20.1% |
| Immigrants | South Africa | 93.9 /100 | #125 | Exceptional 20.1% |
| Serbians | 93.3 /100 | #126 | Exceptional 20.1% |
| Mongolians | 93.2 /100 | #127 | Exceptional 20.2% |
Demographics Similar to Immigrants from Grenada by Single Female Poverty
In terms of single female poverty, the demographic groups most similar to Immigrants from Grenada are Immigrants from Eritrea (21.8%, a difference of 0.010%), German (21.8%, a difference of 0.050%), Scottish (21.8%, a difference of 0.15%), Barbadian (21.8%, a difference of 0.17%), and Panamanian (21.7%, a difference of 0.26%).
| Demographics | Rating | Rank | Single Female Poverty |
| Immigrants | Nicaragua | 13.3 /100 | #214 | Poor 21.6% |
| Ecuadorians | 12.3 /100 | #215 | Poor 21.6% |
| Immigrants | Barbados | 12.2 /100 | #216 | Poor 21.7% |
| Immigrants | St. Vincent and the Grenadines | 11.7 /100 | #217 | Poor 21.7% |
| Nepalese | 9.7 /100 | #218 | Tragic 21.7% |
| Panamanians | 9.4 /100 | #219 | Tragic 21.7% |
| Germans | 8.3 /100 | #220 | Tragic 21.8% |
| Immigrants | Grenada | 8.0 /100 | #221 | Tragic 21.8% |
| Immigrants | Eritrea | 7.9 /100 | #222 | Tragic 21.8% |
| Scottish | 7.3 /100 | #223 | Tragic 21.8% |
| Barbadians | 7.2 /100 | #224 | Tragic 21.8% |
| English | 6.4 /100 | #225 | Tragic 21.9% |
| Immigrants | Portugal | 5.8 /100 | #226 | Tragic 21.9% |
| Immigrants | Ghana | 5.8 /100 | #227 | Tragic 21.9% |
| Salvadorans | 5.5 /100 | #228 | Tragic 21.9% |