White/Caucasian vs South American Married-couple Households
COMPARE
White/Caucasian
South American
Married-couple Households
Married-couple Households Comparison
Whites/Caucasians
South Americans
48.6%
MARRIED-COUPLE HOUSEHOLDS
99.3/ 100
METRIC RATING
53rd/ 347
METRIC RANK
46.6%
MARRIED-COUPLE HOUSEHOLDS
58.0/ 100
METRIC RATING
170th/ 347
METRIC RANK
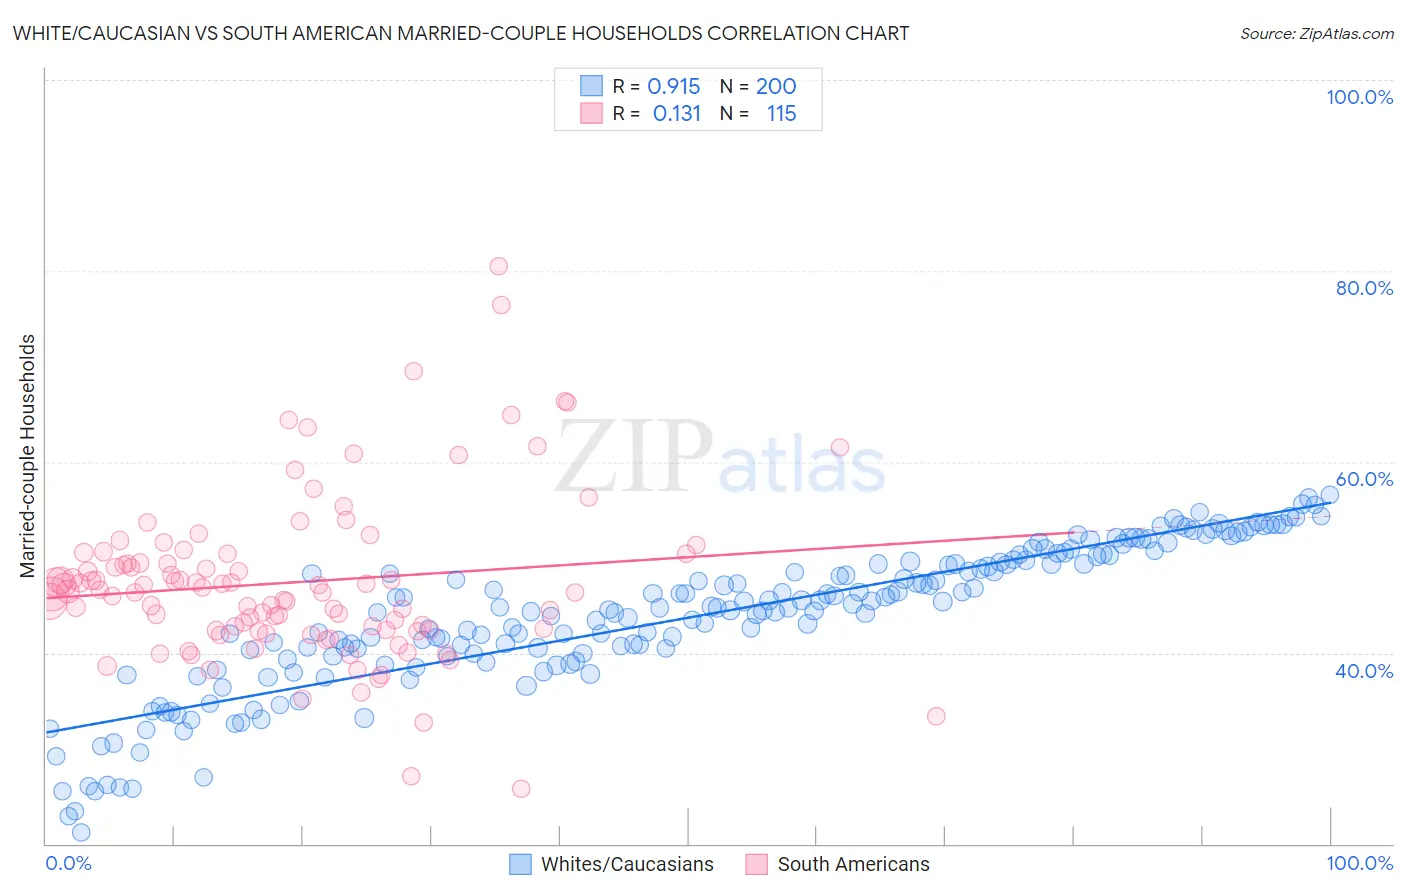
White/Caucasian vs South American Married-couple Households Correlation Chart
The statistical analysis conducted on geographies consisting of 584,446,741 people shows a near-perfect positive correlation between the proportion of Whites/Caucasians and percentage of married-couple family households in the United States with a correlation coefficient (R) of 0.915 and weighted average of 48.6%. Similarly, the statistical analysis conducted on geographies consisting of 493,615,484 people shows a poor positive correlation between the proportion of South Americans and percentage of married-couple family households in the United States with a correlation coefficient (R) of 0.131 and weighted average of 46.6%, a difference of 4.3%.
Married-couple Households Correlation Summary
| Measurement | White/Caucasian | South American |
| Minimum | 21.1% | 25.8% |
| Maximum | 56.5% | 80.5% |
| Range | 35.4% | 54.7% |
| Mean | 43.7% | 47.4% |
| Median | 44.7% | 46.4% |
| Interquartile 25% (IQ1) | 39.7% | 42.4% |
| Interquartile 75% (IQ3) | 49.4% | 50.4% |
| Interquartile Range (IQR) | 9.8% | 7.9% |
| Standard Deviation (Sample) | 7.6% | 8.6% |
| Standard Deviation (Population) | 7.6% | 8.6% |
Similar Demographics by Married-couple Households
Demographics Similar to Whites/Caucasians by Married-couple Households
In terms of married-couple households, the demographic groups most similar to Whites/Caucasians are Immigrants from Lithuania (48.6%, a difference of 0.010%), Austrian (48.6%, a difference of 0.010%), Immigrants from Northern Europe (48.6%, a difference of 0.010%), Irish (48.6%, a difference of 0.050%), and Eastern European (48.6%, a difference of 0.090%).
| Demographics | Rating | Rank | Married-couple Households |
| Tsimshian | 99.5 /100 | #46 | Exceptional 48.7% |
| British | 99.5 /100 | #47 | Exceptional 48.7% |
| Indians (Asian) | 99.4 /100 | #48 | Exceptional 48.7% |
| Immigrants | Sri Lanka | 99.4 /100 | #49 | Exceptional 48.7% |
| Samoans | 99.4 /100 | #50 | Exceptional 48.7% |
| Eastern Europeans | 99.3 /100 | #51 | Exceptional 48.6% |
| Irish | 99.3 /100 | #52 | Exceptional 48.6% |
| Whites/Caucasians | 99.3 /100 | #53 | Exceptional 48.6% |
| Immigrants | Lithuania | 99.3 /100 | #54 | Exceptional 48.6% |
| Austrians | 99.3 /100 | #55 | Exceptional 48.6% |
| Immigrants | Northern Europe | 99.3 /100 | #56 | Exceptional 48.6% |
| Poles | 99.2 /100 | #57 | Exceptional 48.5% |
| Immigrants | Indonesia | 99.2 /100 | #58 | Exceptional 48.5% |
| Czechoslovakians | 99.2 /100 | #59 | Exceptional 48.5% |
| Croatians | 99.1 /100 | #60 | Exceptional 48.5% |
Demographics Similar to South Americans by Married-couple Households
In terms of married-couple households, the demographic groups most similar to South Americans are Spanish American Indian (46.6%, a difference of 0.050%), Immigrants from Chile (46.5%, a difference of 0.090%), Immigrants from Australia (46.5%, a difference of 0.13%), Israeli (46.7%, a difference of 0.17%), and Immigrants from Norway (46.5%, a difference of 0.23%).
| Demographics | Rating | Rank | Married-couple Households |
| Immigrants | Turkey | 70.2 /100 | #163 | Good 46.8% |
| Immigrants | Kazakhstan | 70.0 /100 | #164 | Good 46.8% |
| Immigrants | Southern Europe | 69.9 /100 | #165 | Good 46.8% |
| Cherokee | 65.7 /100 | #166 | Good 46.7% |
| Immigrants | Croatia | 64.2 /100 | #167 | Good 46.7% |
| Israelis | 62.3 /100 | #168 | Good 46.7% |
| Spanish American Indians | 59.4 /100 | #169 | Average 46.6% |
| South Americans | 58.0 /100 | #170 | Average 46.6% |
| Immigrants | Chile | 55.7 /100 | #171 | Average 46.5% |
| Immigrants | Australia | 54.6 /100 | #172 | Average 46.5% |
| Immigrants | Norway | 52.0 /100 | #173 | Average 46.5% |
| Immigrants | Mexico | 50.0 /100 | #174 | Average 46.4% |
| Immigrants | Colombia | 46.1 /100 | #175 | Average 46.4% |
| Cajuns | 45.2 /100 | #176 | Average 46.4% |
| Immigrants | Immigrants | 43.8 /100 | #177 | Average 46.3% |