French vs Seminole Child Poverty Among Girls Under 16
COMPARE
French
Seminole
Child Poverty Among Girls Under 16
Child Poverty Among Girls Under 16 Comparison
French
Seminole
16.0%
CHILD POVERTY AMONG GIRLS UNDER 16
72.8/ 100
METRIC RATING
160th/ 347
METRIC RANK
21.2%
CHILD POVERTY AMONG GIRLS UNDER 16
0.0/ 100
METRIC RATING
302nd/ 347
METRIC RANK
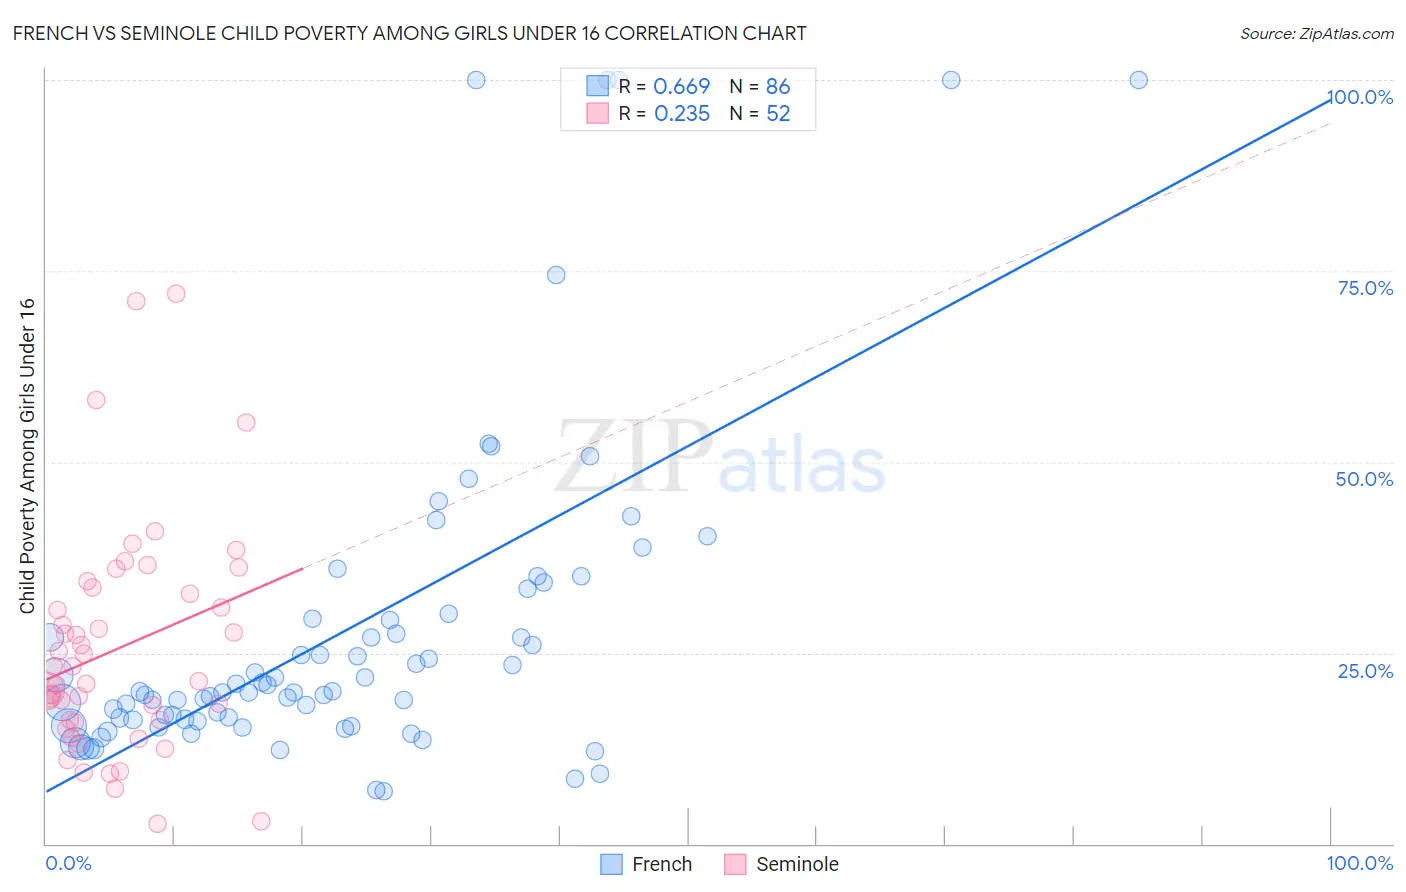
French vs Seminole Child Poverty Among Girls Under 16 Correlation Chart
The statistical analysis conducted on geographies consisting of 549,650,331 people shows a significant positive correlation between the proportion of French and poverty level among girls under the age of 16 in the United States with a correlation coefficient (R) of 0.669 and weighted average of 16.0%. Similarly, the statistical analysis conducted on geographies consisting of 117,946,646 people shows a weak positive correlation between the proportion of Seminole and poverty level among girls under the age of 16 in the United States with a correlation coefficient (R) of 0.235 and weighted average of 21.2%, a difference of 32.3%.
Child Poverty Among Girls Under 16 Correlation Summary
| Measurement | French | Seminole |
| Minimum | 6.8% | 2.6% |
| Maximum | 100.0% | 72.0% |
| Range | 93.2% | 69.4% |
| Mean | 27.8% | 25.5% |
| Median | 19.9% | 22.2% |
| Interquartile 25% (IQ1) | 16.2% | 16.0% |
| Interquartile 75% (IQ3) | 29.5% | 33.1% |
| Interquartile Range (IQR) | 13.3% | 17.2% |
| Standard Deviation (Sample) | 21.4% | 14.9% |
| Standard Deviation (Population) | 21.3% | 14.7% |
Similar Demographics by Child Poverty Among Girls Under 16
Demographics Similar to French by Child Poverty Among Girls Under 16
In terms of child poverty among girls under 16, the demographic groups most similar to French are Immigrants from Northern Africa (16.0%, a difference of 0.11%), Slovak (15.9%, a difference of 0.38%), Guamanian/Chamorro (15.9%, a difference of 0.40%), Immigrants from Fiji (15.9%, a difference of 0.52%), and Colombian (15.9%, a difference of 0.52%).
| Demographics | Rating | Rank | Child Poverty Among Girls Under 16 |
| Immigrants | Nepal | 78.5 /100 | #153 | Good 15.9% |
| Immigrants | Chile | 76.7 /100 | #154 | Good 15.9% |
| Syrians | 76.7 /100 | #155 | Good 15.9% |
| Immigrants | Fiji | 76.1 /100 | #156 | Good 15.9% |
| Colombians | 76.1 /100 | #157 | Good 15.9% |
| Guamanians/Chamorros | 75.3 /100 | #158 | Good 15.9% |
| Slovaks | 75.2 /100 | #159 | Good 15.9% |
| French | 72.8 /100 | #160 | Good 16.0% |
| Immigrants | Northern Africa | 72.0 /100 | #161 | Good 16.0% |
| French Canadians | 68.7 /100 | #162 | Good 16.1% |
| Immigrants | Oceania | 68.4 /100 | #163 | Good 16.1% |
| Immigrants | Colombia | 67.8 /100 | #164 | Good 16.1% |
| Immigrants | Germany | 67.3 /100 | #165 | Good 16.1% |
| South Americans | 67.2 /100 | #166 | Good 16.1% |
| Uruguayans | 64.7 /100 | #167 | Good 16.2% |
Demographics Similar to Seminole by Child Poverty Among Girls Under 16
In terms of child poverty among girls under 16, the demographic groups most similar to Seminole are Choctaw (21.1%, a difference of 0.12%), British West Indian (21.3%, a difference of 0.45%), Indonesian (21.3%, a difference of 0.48%), Somali (21.0%, a difference of 0.73%), and Hispanic or Latino (21.0%, a difference of 1.1%).
| Demographics | Rating | Rank | Child Poverty Among Girls Under 16 |
| Immigrants | Caribbean | 0.0 /100 | #295 | Tragic 20.7% |
| Immigrants | West Indies | 0.0 /100 | #296 | Tragic 20.7% |
| Inupiat | 0.0 /100 | #297 | Tragic 20.8% |
| Mexicans | 0.0 /100 | #298 | Tragic 20.9% |
| Hispanics or Latinos | 0.0 /100 | #299 | Tragic 21.0% |
| Somalis | 0.0 /100 | #300 | Tragic 21.0% |
| Choctaw | 0.0 /100 | #301 | Tragic 21.1% |
| Seminole | 0.0 /100 | #302 | Tragic 21.2% |
| British West Indians | 0.0 /100 | #303 | Tragic 21.3% |
| Indonesians | 0.0 /100 | #304 | Tragic 21.3% |
| Guatemalans | 0.0 /100 | #305 | Tragic 21.4% |
| Immigrants | Central America | 0.0 /100 | #306 | Tragic 21.4% |
| Immigrants | Bahamas | 0.0 /100 | #307 | Tragic 21.4% |
| Houma | 0.0 /100 | #308 | Tragic 21.5% |
| Bahamians | 0.0 /100 | #309 | Tragic 21.5% |