White/Caucasian vs Seminole In Labor Force | Age 20-64
COMPARE
White/Caucasian
Seminole
In Labor Force | Age 20-64
In Labor Force | Age 20-64 Comparison
Whites/Caucasians
Seminole
78.5%
IN LABOR FORCE | AGE 20-64
0.2/ 100
METRIC RATING
261st/ 347
METRIC RANK
75.5%
IN LABOR FORCE | AGE 20-64
0.0/ 100
METRIC RATING
321st/ 347
METRIC RANK
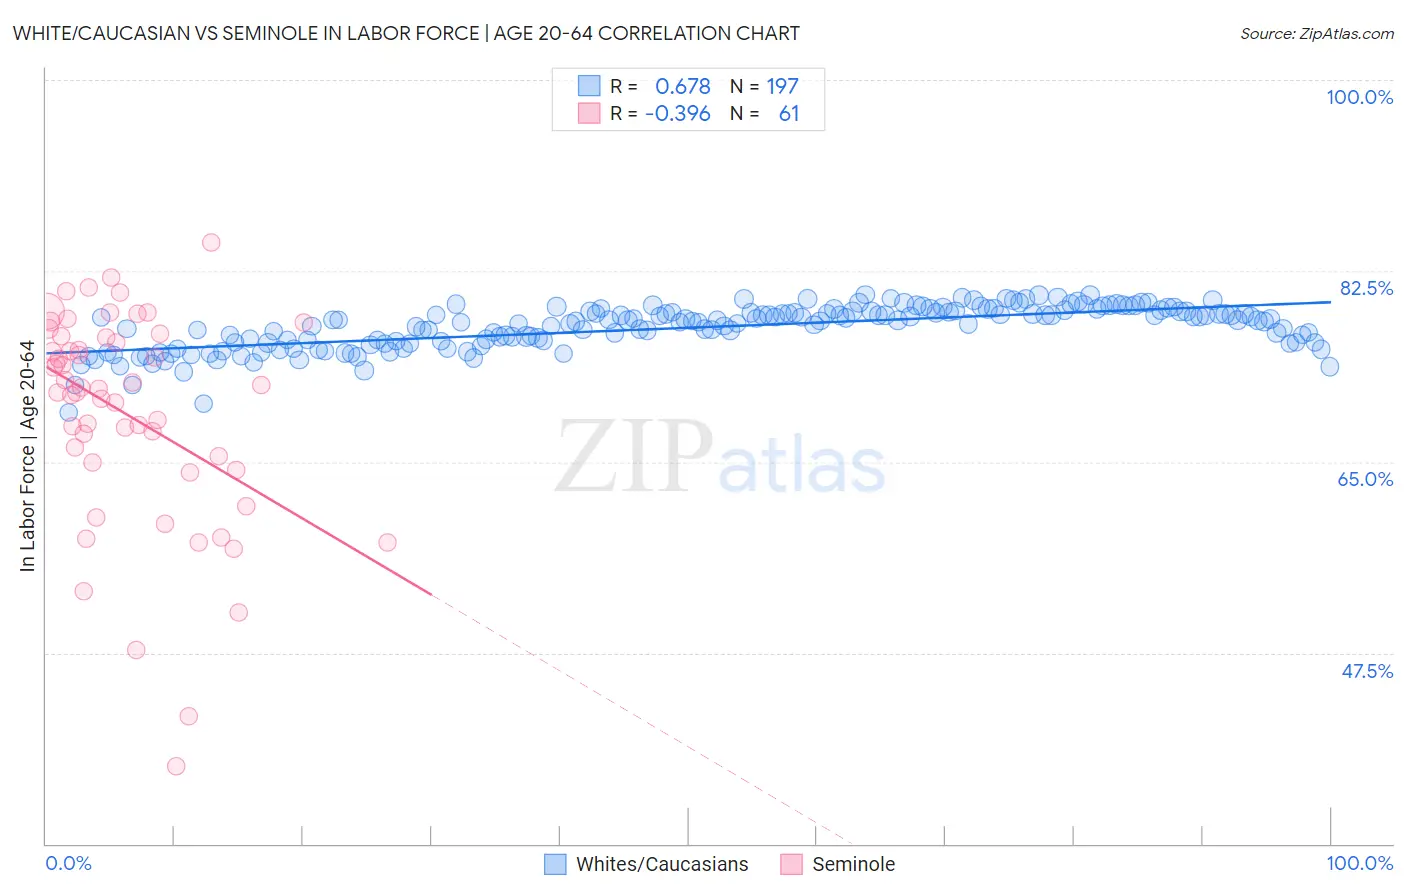
White/Caucasian vs Seminole In Labor Force | Age 20-64 Correlation Chart
The statistical analysis conducted on geographies consisting of 584,882,256 people shows a significant positive correlation between the proportion of Whites/Caucasians and labor force participation rate among population between the ages 20 and 64 in the United States with a correlation coefficient (R) of 0.678 and weighted average of 78.5%. Similarly, the statistical analysis conducted on geographies consisting of 118,311,145 people shows a mild negative correlation between the proportion of Seminole and labor force participation rate among population between the ages 20 and 64 in the United States with a correlation coefficient (R) of -0.396 and weighted average of 75.5%, a difference of 4.0%.
In Labor Force | Age 20-64 Correlation Summary
| Measurement | White/Caucasian | Seminole |
| Minimum | 69.6% | 37.1% |
| Maximum | 80.3% | 85.1% |
| Range | 10.8% | 48.0% |
| Mean | 77.3% | 69.3% |
| Median | 77.9% | 71.7% |
| Interquartile 25% (IQ1) | 75.9% | 64.5% |
| Interquartile 75% (IQ3) | 78.8% | 76.5% |
| Interquartile Range (IQR) | 2.8% | 11.9% |
| Standard Deviation (Sample) | 2.0% | 9.9% |
| Standard Deviation (Population) | 2.0% | 9.8% |
Similar Demographics by In Labor Force | Age 20-64
Demographics Similar to Whites/Caucasians by In Labor Force | Age 20-64
In terms of in labor force | age 20-64, the demographic groups most similar to Whites/Caucasians are Immigrants from Fiji (78.6%, a difference of 0.11%), Fijian (78.4%, a difference of 0.13%), Pennsylvania German (78.4%, a difference of 0.14%), Spaniard (78.4%, a difference of 0.15%), and Tsimshian (78.7%, a difference of 0.18%).
| Demographics | Rating | Rank | In Labor Force | Age 20-64 |
| Immigrants | Lebanon | 0.5 /100 | #254 | Tragic 78.7% |
| Hawaiians | 0.5 /100 | #255 | Tragic 78.7% |
| Celtics | 0.5 /100 | #256 | Tragic 78.7% |
| Guatemalans | 0.4 /100 | #257 | Tragic 78.7% |
| Immigrants | Guatemala | 0.4 /100 | #258 | Tragic 78.7% |
| Tsimshian | 0.4 /100 | #259 | Tragic 78.7% |
| Immigrants | Fiji | 0.3 /100 | #260 | Tragic 78.6% |
| Whites/Caucasians | 0.2 /100 | #261 | Tragic 78.5% |
| Fijians | 0.1 /100 | #262 | Tragic 78.4% |
| Pennsylvania Germans | 0.1 /100 | #263 | Tragic 78.4% |
| Spaniards | 0.1 /100 | #264 | Tragic 78.4% |
| British West Indians | 0.1 /100 | #265 | Tragic 78.4% |
| Bahamians | 0.1 /100 | #266 | Tragic 78.4% |
| U.S. Virgin Islanders | 0.1 /100 | #267 | Tragic 78.4% |
| West Indians | 0.0 /100 | #268 | Tragic 78.3% |
Demographics Similar to Seminole by In Labor Force | Age 20-64
In terms of in labor force | age 20-64, the demographic groups most similar to Seminole are Dutch West Indian (75.5%, a difference of 0.050%), Cajun (75.5%, a difference of 0.090%), Choctaw (75.4%, a difference of 0.14%), Menominee (75.3%, a difference of 0.28%), and Yakama (75.8%, a difference of 0.35%).
| Demographics | Rating | Rank | In Labor Force | Age 20-64 |
| Blacks/African Americans | 0.0 /100 | #314 | Tragic 76.8% |
| Ottawa | 0.0 /100 | #315 | Tragic 76.7% |
| Yaqui | 0.0 /100 | #316 | Tragic 76.5% |
| Cherokee | 0.0 /100 | #317 | Tragic 76.2% |
| Chickasaw | 0.0 /100 | #318 | Tragic 76.2% |
| Inupiat | 0.0 /100 | #319 | Tragic 76.1% |
| Yakama | 0.0 /100 | #320 | Tragic 75.8% |
| Seminole | 0.0 /100 | #321 | Tragic 75.5% |
| Dutch West Indians | 0.0 /100 | #322 | Tragic 75.5% |
| Cajuns | 0.0 /100 | #323 | Tragic 75.5% |
| Choctaw | 0.0 /100 | #324 | Tragic 75.4% |
| Menominee | 0.0 /100 | #325 | Tragic 75.3% |
| Creek | 0.0 /100 | #326 | Tragic 75.1% |
| Sioux | 0.0 /100 | #327 | Tragic 75.0% |
| Kiowa | 0.0 /100 | #328 | Tragic 75.0% |