Immigrants from Scotland vs Seminole Child Poverty Among Girls Under 16
COMPARE
Immigrants from Scotland
Seminole
Child Poverty Among Girls Under 16
Child Poverty Among Girls Under 16 Comparison
Immigrants from Scotland
Seminole
14.0%
CHILD POVERTY AMONG GIRLS UNDER 16
99.4/ 100
METRIC RATING
42nd/ 347
METRIC RANK
21.2%
CHILD POVERTY AMONG GIRLS UNDER 16
0.0/ 100
METRIC RATING
302nd/ 347
METRIC RANK
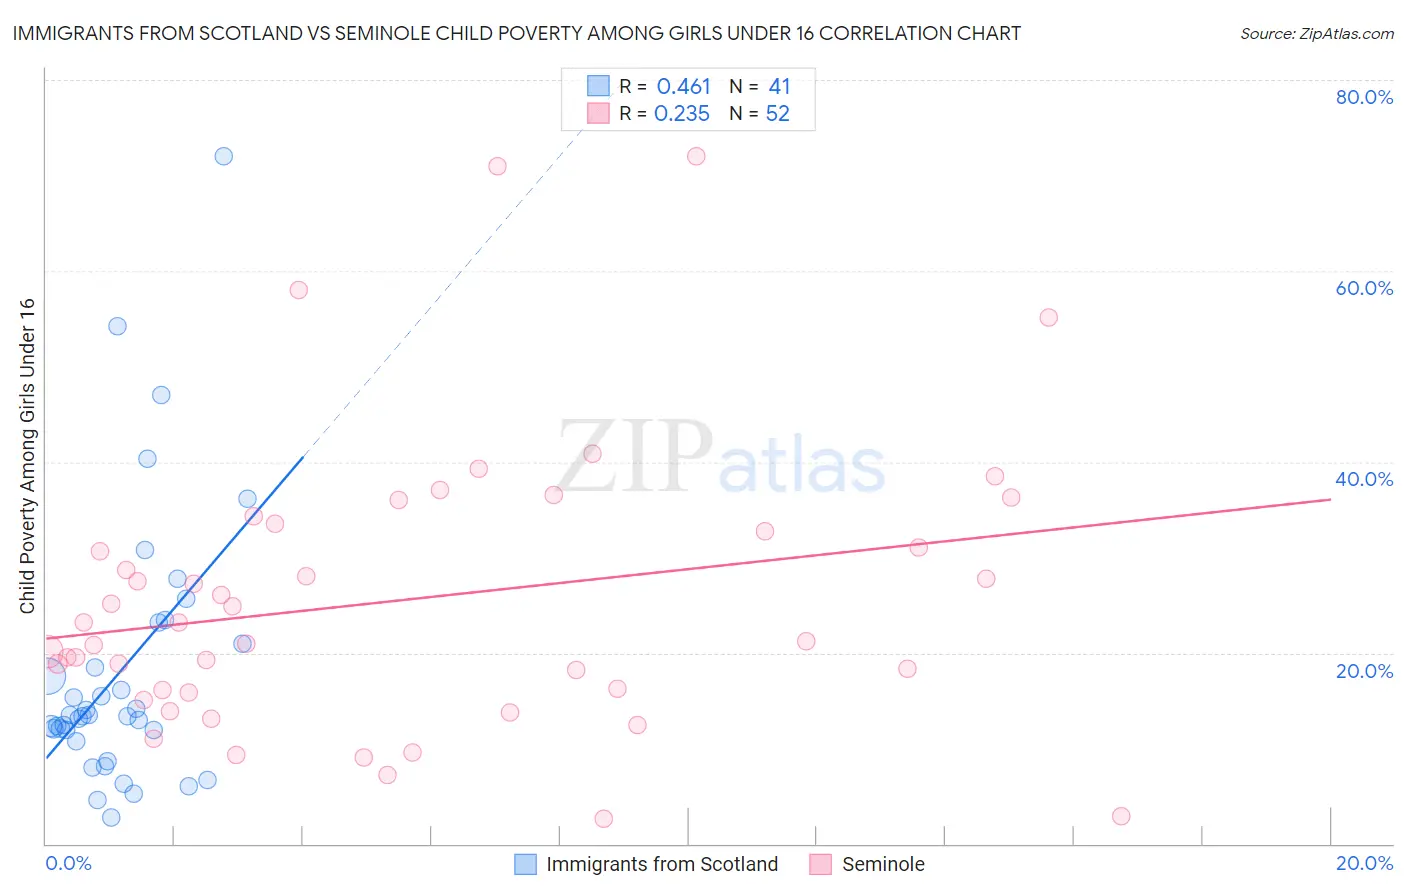
Immigrants from Scotland vs Seminole Child Poverty Among Girls Under 16 Correlation Chart
The statistical analysis conducted on geographies consisting of 193,899,668 people shows a moderate positive correlation between the proportion of Immigrants from Scotland and poverty level among girls under the age of 16 in the United States with a correlation coefficient (R) of 0.461 and weighted average of 14.0%. Similarly, the statistical analysis conducted on geographies consisting of 117,946,646 people shows a weak positive correlation between the proportion of Seminole and poverty level among girls under the age of 16 in the United States with a correlation coefficient (R) of 0.235 and weighted average of 21.2%, a difference of 50.9%.
Child Poverty Among Girls Under 16 Correlation Summary
| Measurement | Immigrants from Scotland | Seminole |
| Minimum | 2.7% | 2.6% |
| Maximum | 72.0% | 72.0% |
| Range | 69.3% | 69.4% |
| Mean | 18.2% | 25.5% |
| Median | 13.3% | 22.2% |
| Interquartile 25% (IQ1) | 11.3% | 16.0% |
| Interquartile 75% (IQ3) | 22.1% | 33.1% |
| Interquartile Range (IQR) | 10.7% | 17.2% |
| Standard Deviation (Sample) | 14.2% | 14.9% |
| Standard Deviation (Population) | 14.0% | 14.7% |
Similar Demographics by Child Poverty Among Girls Under 16
Demographics Similar to Immigrants from Scotland by Child Poverty Among Girls Under 16
In terms of child poverty among girls under 16, the demographic groups most similar to Immigrants from Scotland are Korean (14.1%, a difference of 0.14%), Immigrants from Sri Lanka (14.0%, a difference of 0.16%), Immigrants from Bolivia (14.0%, a difference of 0.16%), Immigrants from Australia (14.0%, a difference of 0.25%), and Immigrants from Asia (14.1%, a difference of 0.29%).
| Demographics | Rating | Rank | Child Poverty Among Girls Under 16 |
| Immigrants | Northern Europe | 99.6 /100 | #35 | Exceptional 13.8% |
| Russians | 99.6 /100 | #36 | Exceptional 13.9% |
| Lithuanians | 99.6 /100 | #37 | Exceptional 13.9% |
| Immigrants | Moldova | 99.6 /100 | #38 | Exceptional 13.9% |
| Immigrants | Australia | 99.5 /100 | #39 | Exceptional 14.0% |
| Immigrants | Sri Lanka | 99.5 /100 | #40 | Exceptional 14.0% |
| Immigrants | Bolivia | 99.5 /100 | #41 | Exceptional 14.0% |
| Immigrants | Scotland | 99.4 /100 | #42 | Exceptional 14.0% |
| Koreans | 99.4 /100 | #43 | Exceptional 14.1% |
| Immigrants | Asia | 99.4 /100 | #44 | Exceptional 14.1% |
| Immigrants | Greece | 99.3 /100 | #45 | Exceptional 14.1% |
| Croatians | 99.3 /100 | #46 | Exceptional 14.1% |
| Immigrants | Czechoslovakia | 99.3 /100 | #47 | Exceptional 14.2% |
| Czechs | 99.3 /100 | #48 | Exceptional 14.2% |
| Greeks | 99.2 /100 | #49 | Exceptional 14.2% |
Demographics Similar to Seminole by Child Poverty Among Girls Under 16
In terms of child poverty among girls under 16, the demographic groups most similar to Seminole are Choctaw (21.1%, a difference of 0.12%), British West Indian (21.3%, a difference of 0.45%), Indonesian (21.3%, a difference of 0.48%), Somali (21.0%, a difference of 0.73%), and Hispanic or Latino (21.0%, a difference of 1.1%).
| Demographics | Rating | Rank | Child Poverty Among Girls Under 16 |
| Immigrants | Caribbean | 0.0 /100 | #295 | Tragic 20.7% |
| Immigrants | West Indies | 0.0 /100 | #296 | Tragic 20.7% |
| Inupiat | 0.0 /100 | #297 | Tragic 20.8% |
| Mexicans | 0.0 /100 | #298 | Tragic 20.9% |
| Hispanics or Latinos | 0.0 /100 | #299 | Tragic 21.0% |
| Somalis | 0.0 /100 | #300 | Tragic 21.0% |
| Choctaw | 0.0 /100 | #301 | Tragic 21.1% |
| Seminole | 0.0 /100 | #302 | Tragic 21.2% |
| British West Indians | 0.0 /100 | #303 | Tragic 21.3% |
| Indonesians | 0.0 /100 | #304 | Tragic 21.3% |
| Guatemalans | 0.0 /100 | #305 | Tragic 21.4% |
| Immigrants | Central America | 0.0 /100 | #306 | Tragic 21.4% |
| Immigrants | Bahamas | 0.0 /100 | #307 | Tragic 21.4% |
| Houma | 0.0 /100 | #308 | Tragic 21.5% |
| Bahamians | 0.0 /100 | #309 | Tragic 21.5% |