White/Caucasian vs Immigrants from Austria Single Mother Poverty
COMPARE
White/Caucasian
Immigrants from Austria
Single Mother Poverty
Single Mother Poverty Comparison
Whites/Caucasians
Immigrants from Austria
31.2%
SINGLE MOTHER POVERTY
0.3/ 100
METRIC RATING
260th/ 347
METRIC RANK
28.4%
SINGLE MOTHER POVERTY
90.3/ 100
METRIC RATING
131st/ 347
METRIC RANK
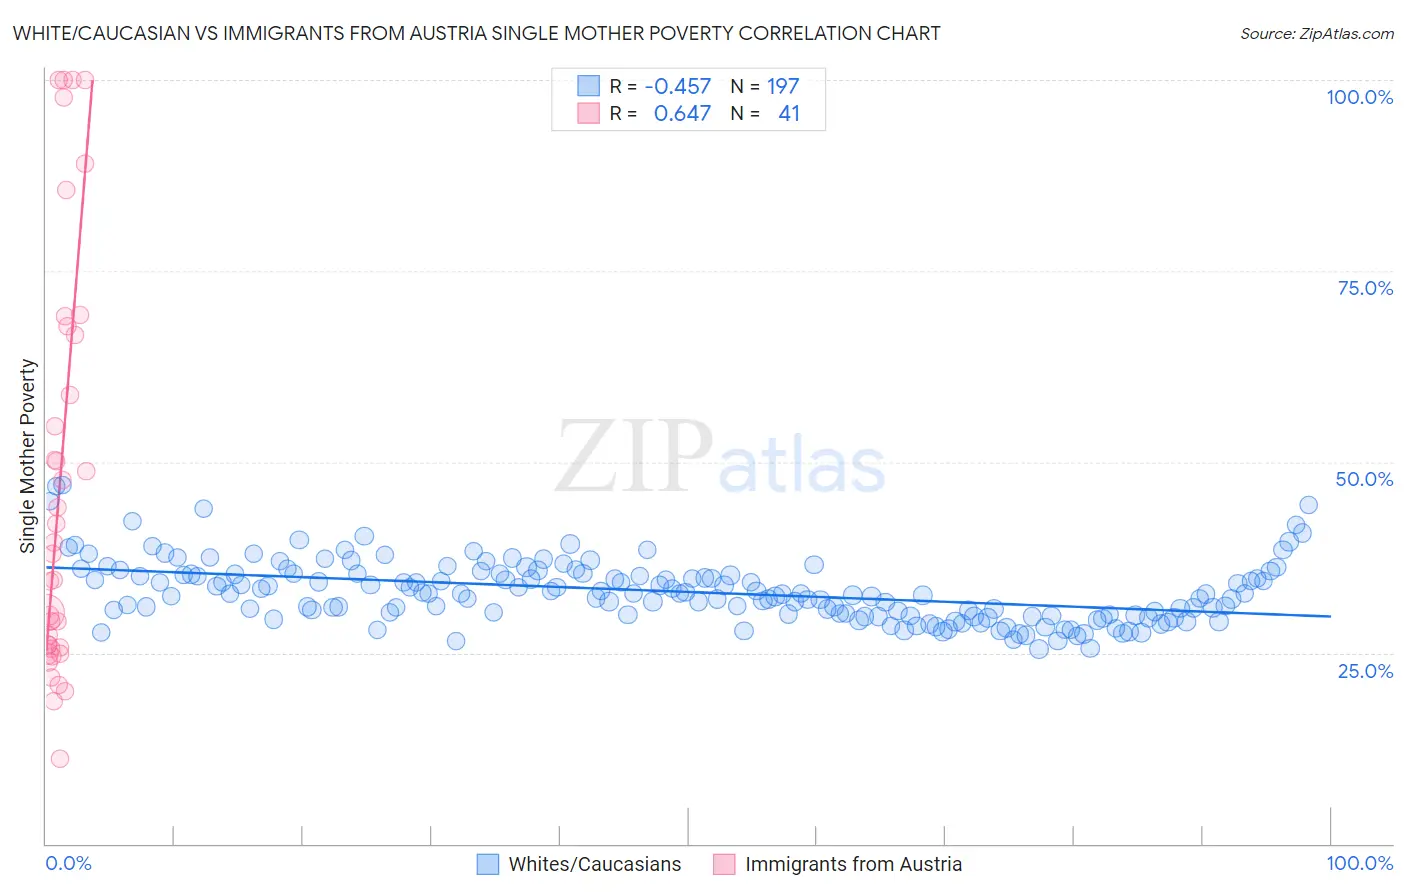
White/Caucasian vs Immigrants from Austria Single Mother Poverty Correlation Chart
The statistical analysis conducted on geographies consisting of 551,530,681 people shows a moderate negative correlation between the proportion of Whites/Caucasians and poverty level among single mothers in the United States with a correlation coefficient (R) of -0.457 and weighted average of 31.2%. Similarly, the statistical analysis conducted on geographies consisting of 164,839,787 people shows a significant positive correlation between the proportion of Immigrants from Austria and poverty level among single mothers in the United States with a correlation coefficient (R) of 0.647 and weighted average of 28.4%, a difference of 9.8%.
Single Mother Poverty Correlation Summary
| Measurement | White/Caucasian | Immigrants from Austria |
| Minimum | 25.5% | 11.1% |
| Maximum | 47.0% | 100.0% |
| Range | 21.5% | 88.9% |
| Mean | 33.0% | 47.0% |
| Median | 32.7% | 38.0% |
| Interquartile 25% (IQ1) | 29.9% | 25.6% |
| Interquartile 75% (IQ3) | 35.3% | 67.2% |
| Interquartile Range (IQR) | 5.4% | 41.6% |
| Standard Deviation (Sample) | 4.0% | 27.0% |
| Standard Deviation (Population) | 4.0% | 26.7% |
Similar Demographics by Single Mother Poverty
Demographics Similar to Whites/Caucasians by Single Mother Poverty
In terms of single mother poverty, the demographic groups most similar to Whites/Caucasians are Immigrants from El Salvador (31.2%, a difference of 0.080%), Immigrants from Bangladesh (31.1%, a difference of 0.16%), Immigrants from Caribbean (31.1%, a difference of 0.19%), Hmong (31.2%, a difference of 0.21%), and Immigrants from Bahamas (31.1%, a difference of 0.28%).
| Demographics | Rating | Rank | Single Mother Poverty |
| Celtics | 0.6 /100 | #253 | Tragic 30.9% |
| Senegalese | 0.5 /100 | #254 | Tragic 31.0% |
| Belizeans | 0.5 /100 | #255 | Tragic 31.0% |
| Immigrants | West Indies | 0.4 /100 | #256 | Tragic 31.1% |
| Immigrants | Bahamas | 0.4 /100 | #257 | Tragic 31.1% |
| Immigrants | Caribbean | 0.4 /100 | #258 | Tragic 31.1% |
| Immigrants | Bangladesh | 0.4 /100 | #259 | Tragic 31.1% |
| Whites/Caucasians | 0.3 /100 | #260 | Tragic 31.2% |
| Immigrants | El Salvador | 0.3 /100 | #261 | Tragic 31.2% |
| Hmong | 0.3 /100 | #262 | Tragic 31.2% |
| Bahamians | 0.2 /100 | #263 | Tragic 31.3% |
| Immigrants | Ecuador | 0.2 /100 | #264 | Tragic 31.3% |
| German Russians | 0.2 /100 | #265 | Tragic 31.3% |
| Sub-Saharan Africans | 0.2 /100 | #266 | Tragic 31.4% |
| Immigrants | Belize | 0.2 /100 | #267 | Tragic 31.4% |
Demographics Similar to Immigrants from Austria by Single Mother Poverty
In terms of single mother poverty, the demographic groups most similar to Immigrants from Austria are Norwegian (28.4%, a difference of 0.010%), South American (28.4%, a difference of 0.020%), Immigrants from England (28.4%, a difference of 0.040%), Polish (28.4%, a difference of 0.070%), and Immigrants from Chile (28.4%, a difference of 0.080%).
| Demographics | Rating | Rank | Single Mother Poverty |
| Immigrants | Switzerland | 91.7 /100 | #124 | Exceptional 28.3% |
| Kenyans | 90.9 /100 | #125 | Exceptional 28.4% |
| Immigrants | Chile | 90.8 /100 | #126 | Exceptional 28.4% |
| Poles | 90.8 /100 | #127 | Exceptional 28.4% |
| Immigrants | England | 90.5 /100 | #128 | Exceptional 28.4% |
| South Americans | 90.4 /100 | #129 | Exceptional 28.4% |
| Norwegians | 90.4 /100 | #130 | Exceptional 28.4% |
| Immigrants | Austria | 90.3 /100 | #131 | Exceptional 28.4% |
| Immigrants | Morocco | 89.5 /100 | #132 | Excellent 28.4% |
| Swedes | 89.4 /100 | #133 | Excellent 28.4% |
| Immigrants | Southern Europe | 89.2 /100 | #134 | Excellent 28.4% |
| Immigrants | Spain | 89.2 /100 | #135 | Excellent 28.4% |
| Native Hawaiians | 88.9 /100 | #136 | Excellent 28.4% |
| Immigrants | Canada | 88.9 /100 | #137 | Excellent 28.4% |
| Immigrants | Belgium | 88.5 /100 | #138 | Excellent 28.5% |