White/Caucasian vs Immigrants from Australia Single Mother Poverty
COMPARE
White/Caucasian
Immigrants from Australia
Single Mother Poverty
Single Mother Poverty Comparison
Whites/Caucasians
Immigrants from Australia
31.2%
SINGLE MOTHER POVERTY
0.3/ 100
METRIC RATING
260th/ 347
METRIC RANK
27.3%
SINGLE MOTHER POVERTY
99.5/ 100
METRIC RATING
67th/ 347
METRIC RANK
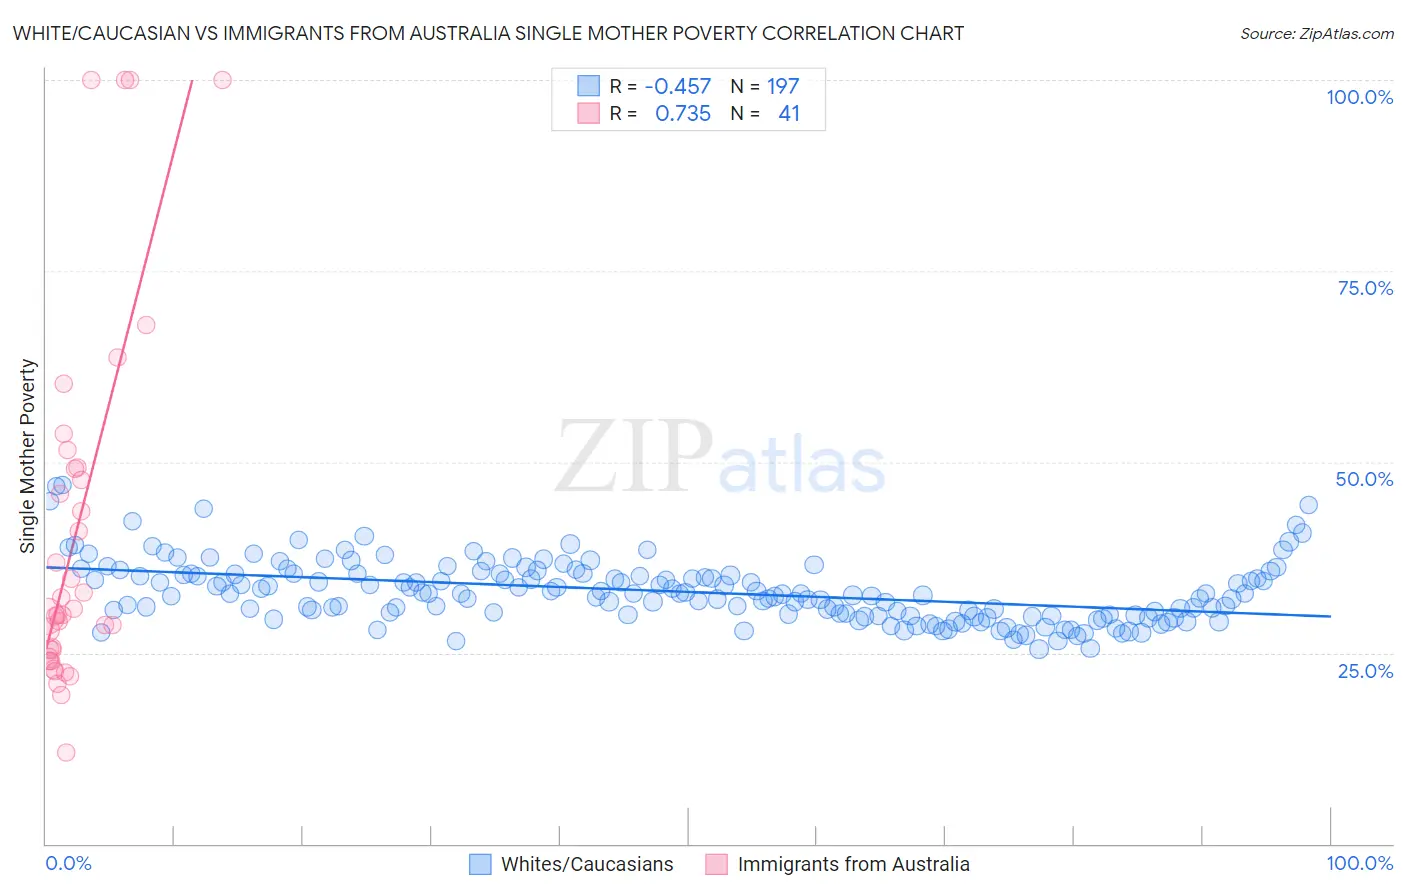
White/Caucasian vs Immigrants from Australia Single Mother Poverty Correlation Chart
The statistical analysis conducted on geographies consisting of 551,530,681 people shows a moderate negative correlation between the proportion of Whites/Caucasians and poverty level among single mothers in the United States with a correlation coefficient (R) of -0.457 and weighted average of 31.2%. Similarly, the statistical analysis conducted on geographies consisting of 222,815,185 people shows a strong positive correlation between the proportion of Immigrants from Australia and poverty level among single mothers in the United States with a correlation coefficient (R) of 0.735 and weighted average of 27.3%, a difference of 14.0%.
Single Mother Poverty Correlation Summary
| Measurement | White/Caucasian | Immigrants from Australia |
| Minimum | 25.5% | 11.9% |
| Maximum | 47.0% | 100.0% |
| Range | 21.5% | 88.1% |
| Mean | 33.0% | 40.6% |
| Median | 32.7% | 30.0% |
| Interquartile 25% (IQ1) | 29.9% | 24.9% |
| Interquartile 75% (IQ3) | 35.3% | 49.2% |
| Interquartile Range (IQR) | 5.4% | 24.3% |
| Standard Deviation (Sample) | 4.0% | 23.5% |
| Standard Deviation (Population) | 4.0% | 23.2% |
Similar Demographics by Single Mother Poverty
Demographics Similar to Whites/Caucasians by Single Mother Poverty
In terms of single mother poverty, the demographic groups most similar to Whites/Caucasians are Immigrants from El Salvador (31.2%, a difference of 0.080%), Immigrants from Bangladesh (31.1%, a difference of 0.16%), Immigrants from Caribbean (31.1%, a difference of 0.19%), Hmong (31.2%, a difference of 0.21%), and Immigrants from Bahamas (31.1%, a difference of 0.28%).
| Demographics | Rating | Rank | Single Mother Poverty |
| Celtics | 0.6 /100 | #253 | Tragic 30.9% |
| Senegalese | 0.5 /100 | #254 | Tragic 31.0% |
| Belizeans | 0.5 /100 | #255 | Tragic 31.0% |
| Immigrants | West Indies | 0.4 /100 | #256 | Tragic 31.1% |
| Immigrants | Bahamas | 0.4 /100 | #257 | Tragic 31.1% |
| Immigrants | Caribbean | 0.4 /100 | #258 | Tragic 31.1% |
| Immigrants | Bangladesh | 0.4 /100 | #259 | Tragic 31.1% |
| Whites/Caucasians | 0.3 /100 | #260 | Tragic 31.2% |
| Immigrants | El Salvador | 0.3 /100 | #261 | Tragic 31.2% |
| Hmong | 0.3 /100 | #262 | Tragic 31.2% |
| Bahamians | 0.2 /100 | #263 | Tragic 31.3% |
| Immigrants | Ecuador | 0.2 /100 | #264 | Tragic 31.3% |
| German Russians | 0.2 /100 | #265 | Tragic 31.3% |
| Sub-Saharan Africans | 0.2 /100 | #266 | Tragic 31.4% |
| Immigrants | Belize | 0.2 /100 | #267 | Tragic 31.4% |
Demographics Similar to Immigrants from Australia by Single Mother Poverty
In terms of single mother poverty, the demographic groups most similar to Immigrants from Australia are Soviet Union (27.3%, a difference of 0.020%), Immigrants from Czechoslovakia (27.4%, a difference of 0.030%), Immigrants from Turkey (27.3%, a difference of 0.060%), Russian (27.3%, a difference of 0.14%), and Immigrants from Northern Europe (27.3%, a difference of 0.17%).
| Demographics | Rating | Rank | Single Mother Poverty |
| Eastern Europeans | 99.6 /100 | #60 | Exceptional 27.2% |
| Immigrants | Eastern Europe | 99.6 /100 | #61 | Exceptional 27.2% |
| Immigrants | Malaysia | 99.5 /100 | #62 | Exceptional 27.3% |
| Immigrants | Northern Europe | 99.5 /100 | #63 | Exceptional 27.3% |
| Russians | 99.5 /100 | #64 | Exceptional 27.3% |
| Immigrants | Turkey | 99.5 /100 | #65 | Exceptional 27.3% |
| Soviet Union | 99.5 /100 | #66 | Exceptional 27.3% |
| Immigrants | Australia | 99.5 /100 | #67 | Exceptional 27.3% |
| Immigrants | Czechoslovakia | 99.5 /100 | #68 | Exceptional 27.4% |
| Lithuanians | 99.4 /100 | #69 | Exceptional 27.4% |
| Immigrants | Belarus | 99.4 /100 | #70 | Exceptional 27.4% |
| Macedonians | 99.4 /100 | #71 | Exceptional 27.4% |
| Immigrants | Russia | 99.4 /100 | #72 | Exceptional 27.4% |
| Sierra Leoneans | 99.3 /100 | #73 | Exceptional 27.4% |
| Immigrants | Europe | 99.3 /100 | #74 | Exceptional 27.4% |