Czech vs Immigrants from Austria Single Mother Poverty
COMPARE
Czech
Immigrants from Austria
Single Mother Poverty
Single Mother Poverty Comparison
Czechs
Immigrants from Austria
28.9%
SINGLE MOTHER POVERTY
68.4/ 100
METRIC RATING
159th/ 347
METRIC RANK
28.4%
SINGLE MOTHER POVERTY
90.3/ 100
METRIC RATING
131st/ 347
METRIC RANK
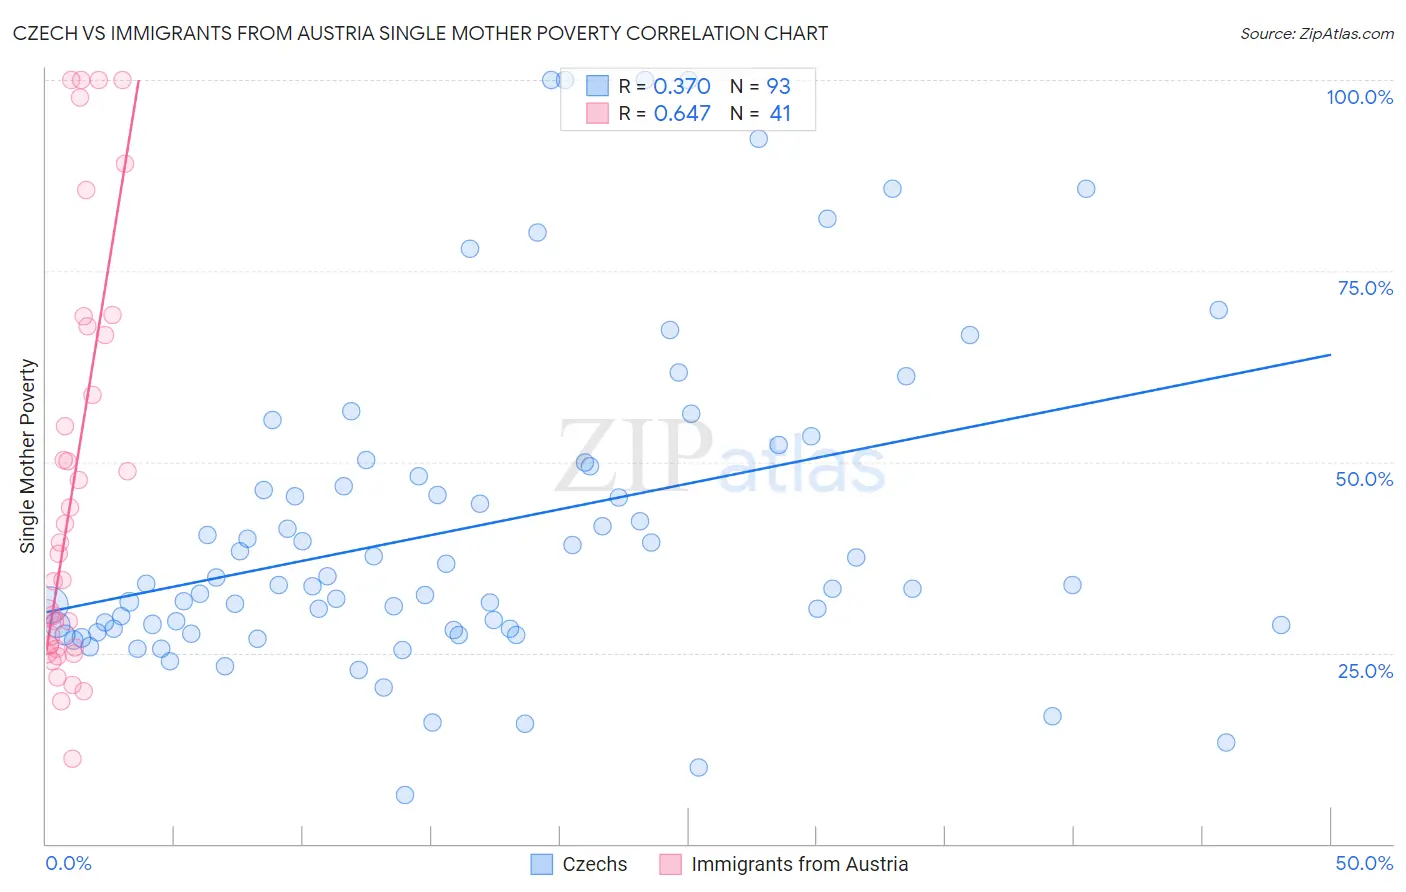
Czech vs Immigrants from Austria Single Mother Poverty Correlation Chart
The statistical analysis conducted on geographies consisting of 466,588,307 people shows a mild positive correlation between the proportion of Czechs and poverty level among single mothers in the United States with a correlation coefficient (R) of 0.370 and weighted average of 28.9%. Similarly, the statistical analysis conducted on geographies consisting of 164,839,787 people shows a significant positive correlation between the proportion of Immigrants from Austria and poverty level among single mothers in the United States with a correlation coefficient (R) of 0.647 and weighted average of 28.4%, a difference of 1.8%.
Single Mother Poverty Correlation Summary
| Measurement | Czech | Immigrants from Austria |
| Minimum | 6.4% | 11.1% |
| Maximum | 100.0% | 100.0% |
| Range | 93.6% | 88.9% |
| Mean | 41.3% | 47.0% |
| Median | 33.8% | 38.0% |
| Interquartile 25% (IQ1) | 28.1% | 25.6% |
| Interquartile 75% (IQ3) | 48.7% | 67.2% |
| Interquartile Range (IQR) | 20.7% | 41.6% |
| Standard Deviation (Sample) | 21.1% | 27.0% |
| Standard Deviation (Population) | 21.0% | 26.7% |
Similar Demographics by Single Mother Poverty
Demographics Similar to Czechs by Single Mother Poverty
In terms of single mother poverty, the demographic groups most similar to Czechs are Japanese (28.9%, a difference of 0.020%), Immigrants from Cambodia (28.9%, a difference of 0.10%), Immigrants from Hungary (28.9%, a difference of 0.12%), Scandinavian (28.9%, a difference of 0.12%), and Immigrants from Nigeria (28.9%, a difference of 0.14%).
| Demographics | Rating | Rank | Single Mother Poverty |
| Austrians | 79.0 /100 | #152 | Good 28.7% |
| Slovenes | 76.4 /100 | #153 | Good 28.8% |
| Portuguese | 73.2 /100 | #154 | Good 28.8% |
| Ugandans | 71.7 /100 | #155 | Good 28.8% |
| Iraqis | 71.5 /100 | #156 | Good 28.8% |
| Immigrants | Western Europe | 71.1 /100 | #157 | Good 28.9% |
| Immigrants | Hungary | 70.6 /100 | #158 | Good 28.9% |
| Czechs | 68.4 /100 | #159 | Good 28.9% |
| Japanese | 68.0 /100 | #160 | Good 28.9% |
| Immigrants | Cambodia | 66.6 /100 | #161 | Good 28.9% |
| Scandinavians | 66.2 /100 | #162 | Good 28.9% |
| Immigrants | Nigeria | 65.9 /100 | #163 | Good 28.9% |
| Immigrants | Kenya | 65.9 /100 | #164 | Good 28.9% |
| Arabs | 60.7 /100 | #165 | Good 29.0% |
| Inupiat | 60.4 /100 | #166 | Good 29.0% |
Demographics Similar to Immigrants from Austria by Single Mother Poverty
In terms of single mother poverty, the demographic groups most similar to Immigrants from Austria are Norwegian (28.4%, a difference of 0.010%), South American (28.4%, a difference of 0.020%), Immigrants from England (28.4%, a difference of 0.040%), Polish (28.4%, a difference of 0.070%), and Immigrants from Chile (28.4%, a difference of 0.080%).
| Demographics | Rating | Rank | Single Mother Poverty |
| Immigrants | Switzerland | 91.7 /100 | #124 | Exceptional 28.3% |
| Kenyans | 90.9 /100 | #125 | Exceptional 28.4% |
| Immigrants | Chile | 90.8 /100 | #126 | Exceptional 28.4% |
| Poles | 90.8 /100 | #127 | Exceptional 28.4% |
| Immigrants | England | 90.5 /100 | #128 | Exceptional 28.4% |
| South Americans | 90.4 /100 | #129 | Exceptional 28.4% |
| Norwegians | 90.4 /100 | #130 | Exceptional 28.4% |
| Immigrants | Austria | 90.3 /100 | #131 | Exceptional 28.4% |
| Immigrants | Morocco | 89.5 /100 | #132 | Excellent 28.4% |
| Swedes | 89.4 /100 | #133 | Excellent 28.4% |
| Immigrants | Southern Europe | 89.2 /100 | #134 | Excellent 28.4% |
| Immigrants | Spain | 89.2 /100 | #135 | Excellent 28.4% |
| Native Hawaiians | 88.9 /100 | #136 | Excellent 28.4% |
| Immigrants | Canada | 88.9 /100 | #137 | Excellent 28.4% |
| Immigrants | Belgium | 88.5 /100 | #138 | Excellent 28.5% |