Swiss vs Immigrants from Austria Single Mother Poverty
COMPARE
Swiss
Immigrants from Austria
Single Mother Poverty
Single Mother Poverty Comparison
Swiss
Immigrants from Austria
29.7%
SINGLE MOTHER POVERTY
17.2/ 100
METRIC RATING
203rd/ 347
METRIC RANK
28.4%
SINGLE MOTHER POVERTY
90.3/ 100
METRIC RATING
131st/ 347
METRIC RANK
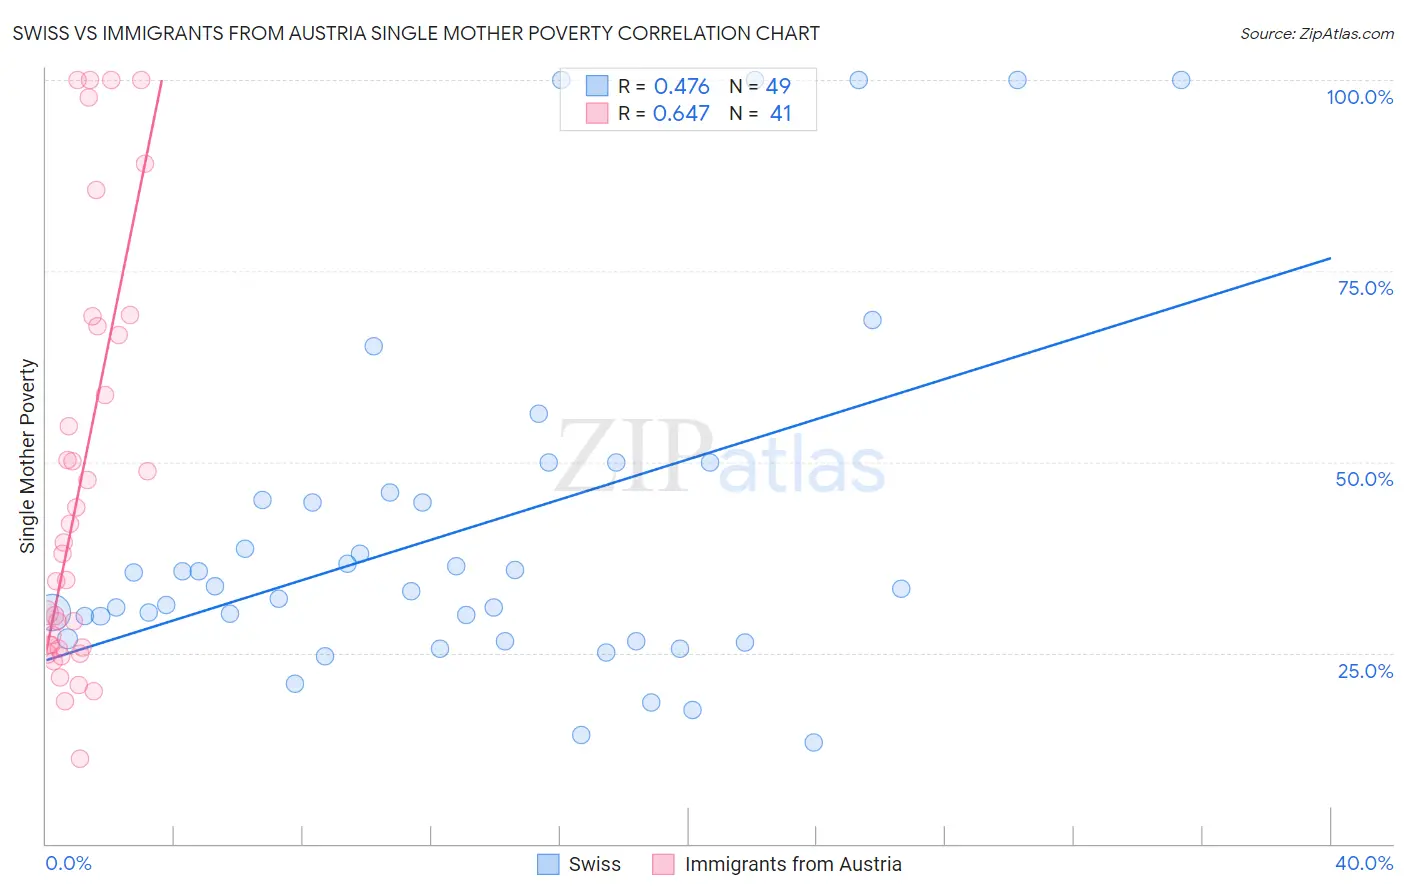
Swiss vs Immigrants from Austria Single Mother Poverty Correlation Chart
The statistical analysis conducted on geographies consisting of 448,256,315 people shows a moderate positive correlation between the proportion of Swiss and poverty level among single mothers in the United States with a correlation coefficient (R) of 0.476 and weighted average of 29.7%. Similarly, the statistical analysis conducted on geographies consisting of 164,839,787 people shows a significant positive correlation between the proportion of Immigrants from Austria and poverty level among single mothers in the United States with a correlation coefficient (R) of 0.647 and weighted average of 28.4%, a difference of 4.7%.
Single Mother Poverty Correlation Summary
| Measurement | Swiss | Immigrants from Austria |
| Minimum | 13.3% | 11.1% |
| Maximum | 100.0% | 100.0% |
| Range | 86.7% | 88.9% |
| Mean | 41.0% | 47.0% |
| Median | 33.3% | 38.0% |
| Interquartile 25% (IQ1) | 26.7% | 25.6% |
| Interquartile 75% (IQ3) | 45.5% | 67.2% |
| Interquartile Range (IQR) | 18.8% | 41.6% |
| Standard Deviation (Sample) | 23.1% | 27.0% |
| Standard Deviation (Population) | 22.8% | 26.7% |
Similar Demographics by Single Mother Poverty
Demographics Similar to Swiss by Single Mother Poverty
In terms of single mother poverty, the demographic groups most similar to Swiss are Malaysian (29.7%, a difference of 0.020%), Immigrants (29.7%, a difference of 0.050%), Czechoslovakian (29.7%, a difference of 0.10%), Belgian (29.7%, a difference of 0.12%), and Immigrants from Haiti (29.7%, a difference of 0.12%).
| Demographics | Rating | Rank | Single Mother Poverty |
| Spanish American Indians | 23.4 /100 | #196 | Fair 29.6% |
| Immigrants | Jamaica | 22.0 /100 | #197 | Fair 29.6% |
| Trinidadians and Tobagonians | 21.7 /100 | #198 | Fair 29.6% |
| Cubans | 20.8 /100 | #199 | Fair 29.6% |
| Panamanians | 20.0 /100 | #200 | Fair 29.6% |
| Belgians | 18.8 /100 | #201 | Poor 29.7% |
| Malaysians | 17.4 /100 | #202 | Poor 29.7% |
| Swiss | 17.2 /100 | #203 | Poor 29.7% |
| Immigrants | Immigrants | 16.6 /100 | #204 | Poor 29.7% |
| Czechoslovakians | 16.1 /100 | #205 | Poor 29.7% |
| Immigrants | Haiti | 15.8 /100 | #206 | Poor 29.7% |
| Immigrants | Panama | 15.5 /100 | #207 | Poor 29.8% |
| Immigrants | Guyana | 14.7 /100 | #208 | Poor 29.8% |
| Irish | 13.9 /100 | #209 | Poor 29.8% |
| Haitians | 13.3 /100 | #210 | Poor 29.8% |
Demographics Similar to Immigrants from Austria by Single Mother Poverty
In terms of single mother poverty, the demographic groups most similar to Immigrants from Austria are Norwegian (28.4%, a difference of 0.010%), South American (28.4%, a difference of 0.020%), Immigrants from England (28.4%, a difference of 0.040%), Polish (28.4%, a difference of 0.070%), and Immigrants from Chile (28.4%, a difference of 0.080%).
| Demographics | Rating | Rank | Single Mother Poverty |
| Immigrants | Switzerland | 91.7 /100 | #124 | Exceptional 28.3% |
| Kenyans | 90.9 /100 | #125 | Exceptional 28.4% |
| Immigrants | Chile | 90.8 /100 | #126 | Exceptional 28.4% |
| Poles | 90.8 /100 | #127 | Exceptional 28.4% |
| Immigrants | England | 90.5 /100 | #128 | Exceptional 28.4% |
| South Americans | 90.4 /100 | #129 | Exceptional 28.4% |
| Norwegians | 90.4 /100 | #130 | Exceptional 28.4% |
| Immigrants | Austria | 90.3 /100 | #131 | Exceptional 28.4% |
| Immigrants | Morocco | 89.5 /100 | #132 | Excellent 28.4% |
| Swedes | 89.4 /100 | #133 | Excellent 28.4% |
| Immigrants | Southern Europe | 89.2 /100 | #134 | Excellent 28.4% |
| Immigrants | Spain | 89.2 /100 | #135 | Excellent 28.4% |
| Native Hawaiians | 88.9 /100 | #136 | Excellent 28.4% |
| Immigrants | Canada | 88.9 /100 | #137 | Excellent 28.4% |
| Immigrants | Belgium | 88.5 /100 | #138 | Excellent 28.5% |