Paraguayan vs Immigrants from Austria Single Mother Poverty
COMPARE
Paraguayan
Immigrants from Austria
Single Mother Poverty
Single Mother Poverty Comparison
Paraguayans
Immigrants from Austria
27.2%
SINGLE MOTHER POVERTY
99.6/ 100
METRIC RATING
59th/ 347
METRIC RANK
28.4%
SINGLE MOTHER POVERTY
90.3/ 100
METRIC RATING
131st/ 347
METRIC RANK
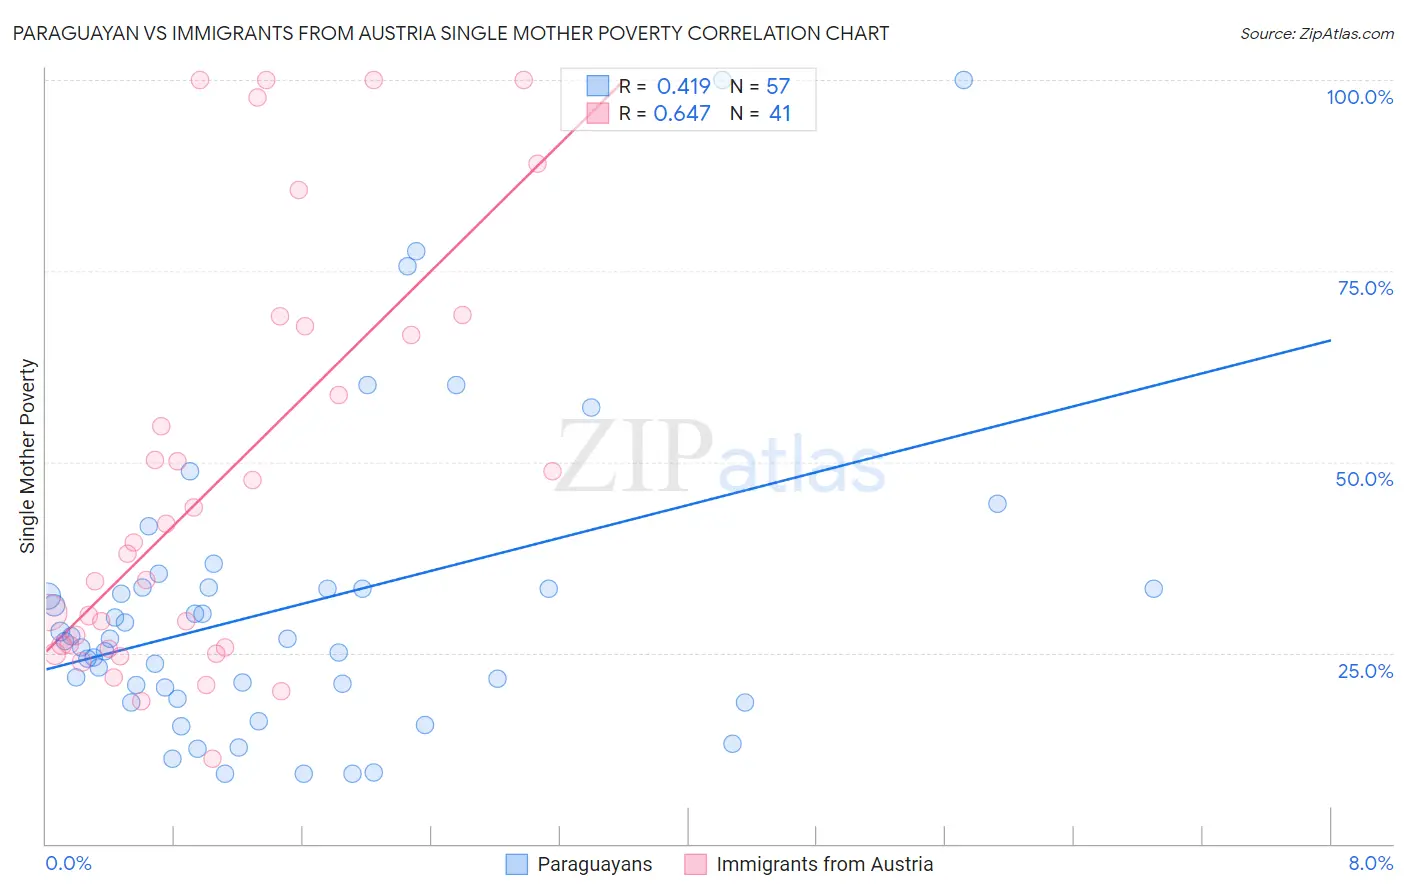
Paraguayan vs Immigrants from Austria Single Mother Poverty Correlation Chart
The statistical analysis conducted on geographies consisting of 94,301,501 people shows a moderate positive correlation between the proportion of Paraguayans and poverty level among single mothers in the United States with a correlation coefficient (R) of 0.419 and weighted average of 27.2%. Similarly, the statistical analysis conducted on geographies consisting of 164,839,787 people shows a significant positive correlation between the proportion of Immigrants from Austria and poverty level among single mothers in the United States with a correlation coefficient (R) of 0.647 and weighted average of 28.4%, a difference of 4.3%.
Single Mother Poverty Correlation Summary
| Measurement | Paraguayan | Immigrants from Austria |
| Minimum | 9.1% | 11.1% |
| Maximum | 100.0% | 100.0% |
| Range | 90.9% | 88.9% |
| Mean | 31.1% | 47.0% |
| Median | 26.8% | 38.0% |
| Interquartile 25% (IQ1) | 19.7% | 25.6% |
| Interquartile 75% (IQ3) | 33.4% | 67.2% |
| Interquartile Range (IQR) | 13.7% | 41.6% |
| Standard Deviation (Sample) | 19.9% | 27.0% |
| Standard Deviation (Population) | 19.7% | 26.7% |
Similar Demographics by Single Mother Poverty
Demographics Similar to Paraguayans by Single Mother Poverty
In terms of single mother poverty, the demographic groups most similar to Paraguayans are Argentinean (27.2%, a difference of 0.010%), Eastern European (27.2%, a difference of 0.040%), Immigrants from Eastern Europe (27.2%, a difference of 0.15%), Palestinian (27.2%, a difference of 0.17%), and Immigrants from Romania (27.2%, a difference of 0.20%).
| Demographics | Rating | Rank | Single Mother Poverty |
| Immigrants | South Eastern Asia | 99.7 /100 | #52 | Exceptional 27.1% |
| Immigrants | Jordan | 99.7 /100 | #53 | Exceptional 27.1% |
| Immigrants | Bulgaria | 99.7 /100 | #54 | Exceptional 27.1% |
| Immigrants | Egypt | 99.7 /100 | #55 | Exceptional 27.1% |
| Immigrants | Romania | 99.7 /100 | #56 | Exceptional 27.2% |
| Palestinians | 99.7 /100 | #57 | Exceptional 27.2% |
| Argentineans | 99.6 /100 | #58 | Exceptional 27.2% |
| Paraguayans | 99.6 /100 | #59 | Exceptional 27.2% |
| Eastern Europeans | 99.6 /100 | #60 | Exceptional 27.2% |
| Immigrants | Eastern Europe | 99.6 /100 | #61 | Exceptional 27.2% |
| Immigrants | Malaysia | 99.5 /100 | #62 | Exceptional 27.3% |
| Immigrants | Northern Europe | 99.5 /100 | #63 | Exceptional 27.3% |
| Russians | 99.5 /100 | #64 | Exceptional 27.3% |
| Immigrants | Turkey | 99.5 /100 | #65 | Exceptional 27.3% |
| Soviet Union | 99.5 /100 | #66 | Exceptional 27.3% |
Demographics Similar to Immigrants from Austria by Single Mother Poverty
In terms of single mother poverty, the demographic groups most similar to Immigrants from Austria are Norwegian (28.4%, a difference of 0.010%), South American (28.4%, a difference of 0.020%), Immigrants from England (28.4%, a difference of 0.040%), Polish (28.4%, a difference of 0.070%), and Immigrants from Chile (28.4%, a difference of 0.080%).
| Demographics | Rating | Rank | Single Mother Poverty |
| Immigrants | Switzerland | 91.7 /100 | #124 | Exceptional 28.3% |
| Kenyans | 90.9 /100 | #125 | Exceptional 28.4% |
| Immigrants | Chile | 90.8 /100 | #126 | Exceptional 28.4% |
| Poles | 90.8 /100 | #127 | Exceptional 28.4% |
| Immigrants | England | 90.5 /100 | #128 | Exceptional 28.4% |
| South Americans | 90.4 /100 | #129 | Exceptional 28.4% |
| Norwegians | 90.4 /100 | #130 | Exceptional 28.4% |
| Immigrants | Austria | 90.3 /100 | #131 | Exceptional 28.4% |
| Immigrants | Morocco | 89.5 /100 | #132 | Excellent 28.4% |
| Swedes | 89.4 /100 | #133 | Excellent 28.4% |
| Immigrants | Southern Europe | 89.2 /100 | #134 | Excellent 28.4% |
| Immigrants | Spain | 89.2 /100 | #135 | Excellent 28.4% |
| Native Hawaiians | 88.9 /100 | #136 | Excellent 28.4% |
| Immigrants | Canada | 88.9 /100 | #137 | Excellent 28.4% |
| Immigrants | Belgium | 88.5 /100 | #138 | Excellent 28.5% |