Menominee vs Immigrants from Austria Single Mother Poverty
COMPARE
Menominee
Immigrants from Austria
Single Mother Poverty
Single Mother Poverty Comparison
Menominee
Immigrants from Austria
37.1%
SINGLE MOTHER POVERTY
0.0/ 100
METRIC RATING
333rd/ 347
METRIC RANK
28.4%
SINGLE MOTHER POVERTY
90.3/ 100
METRIC RATING
131st/ 347
METRIC RANK
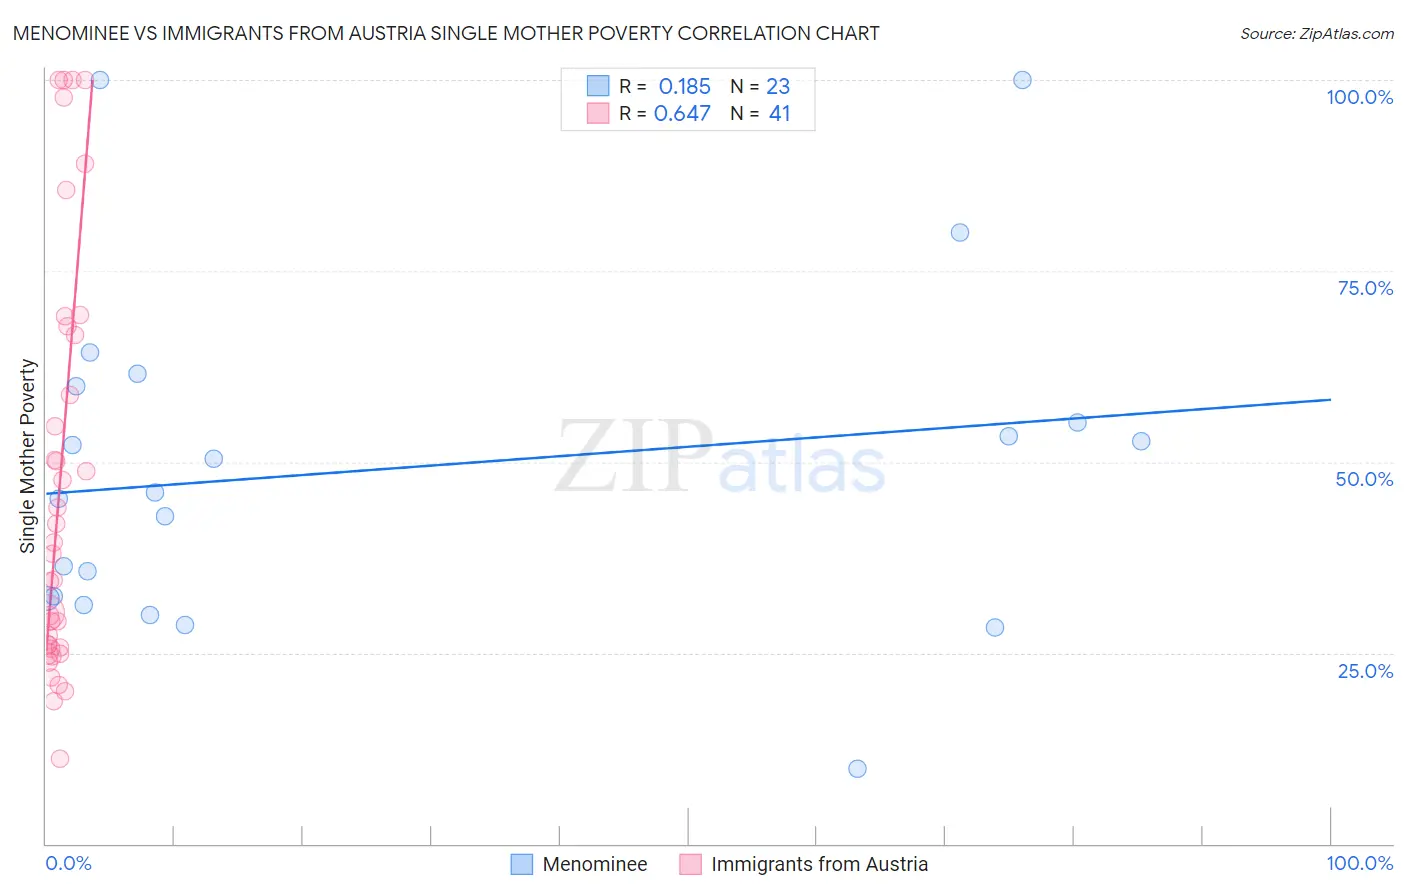
Menominee vs Immigrants from Austria Single Mother Poverty Correlation Chart
The statistical analysis conducted on geographies consisting of 45,498,385 people shows a poor positive correlation between the proportion of Menominee and poverty level among single mothers in the United States with a correlation coefficient (R) of 0.185 and weighted average of 37.1%. Similarly, the statistical analysis conducted on geographies consisting of 164,839,787 people shows a significant positive correlation between the proportion of Immigrants from Austria and poverty level among single mothers in the United States with a correlation coefficient (R) of 0.647 and weighted average of 28.4%, a difference of 30.5%.
Single Mother Poverty Correlation Summary
| Measurement | Menominee | Immigrants from Austria |
| Minimum | 9.8% | 11.1% |
| Maximum | 100.0% | 100.0% |
| Range | 90.2% | 88.9% |
| Mean | 49.1% | 47.0% |
| Median | 46.0% | 38.0% |
| Interquartile 25% (IQ1) | 32.1% | 25.6% |
| Interquartile 75% (IQ3) | 59.9% | 67.2% |
| Interquartile Range (IQR) | 27.8% | 41.6% |
| Standard Deviation (Sample) | 22.1% | 27.0% |
| Standard Deviation (Population) | 21.6% | 26.7% |
Similar Demographics by Single Mother Poverty
Demographics Similar to Menominee by Single Mother Poverty
In terms of single mother poverty, the demographic groups most similar to Menominee are Pueblo (37.2%, a difference of 0.37%), Dutch West Indian (36.8%, a difference of 0.78%), Creek (36.7%, a difference of 1.0%), Native/Alaskan (36.6%, a difference of 1.2%), and Apache (36.6%, a difference of 1.3%).
| Demographics | Rating | Rank | Single Mother Poverty |
| Seminole | 0.0 /100 | #326 | Tragic 35.8% |
| Yakama | 0.0 /100 | #327 | Tragic 36.4% |
| Choctaw | 0.0 /100 | #328 | Tragic 36.4% |
| Apache | 0.0 /100 | #329 | Tragic 36.6% |
| Natives/Alaskans | 0.0 /100 | #330 | Tragic 36.6% |
| Creek | 0.0 /100 | #331 | Tragic 36.7% |
| Dutch West Indians | 0.0 /100 | #332 | Tragic 36.8% |
| Menominee | 0.0 /100 | #333 | Tragic 37.1% |
| Pueblo | 0.0 /100 | #334 | Tragic 37.2% |
| Yuman | 0.0 /100 | #335 | Tragic 37.8% |
| Cheyenne | 0.0 /100 | #336 | Tragic 38.5% |
| Immigrants | Yemen | 0.0 /100 | #337 | Tragic 38.5% |
| Pima | 0.0 /100 | #338 | Tragic 38.6% |
| Crow | 0.0 /100 | #339 | Tragic 38.6% |
| Sioux | 0.0 /100 | #340 | Tragic 38.8% |
Demographics Similar to Immigrants from Austria by Single Mother Poverty
In terms of single mother poverty, the demographic groups most similar to Immigrants from Austria are Norwegian (28.4%, a difference of 0.010%), South American (28.4%, a difference of 0.020%), Immigrants from England (28.4%, a difference of 0.040%), Polish (28.4%, a difference of 0.070%), and Immigrants from Chile (28.4%, a difference of 0.080%).
| Demographics | Rating | Rank | Single Mother Poverty |
| Immigrants | Switzerland | 91.7 /100 | #124 | Exceptional 28.3% |
| Kenyans | 90.9 /100 | #125 | Exceptional 28.4% |
| Immigrants | Chile | 90.8 /100 | #126 | Exceptional 28.4% |
| Poles | 90.8 /100 | #127 | Exceptional 28.4% |
| Immigrants | England | 90.5 /100 | #128 | Exceptional 28.4% |
| South Americans | 90.4 /100 | #129 | Exceptional 28.4% |
| Norwegians | 90.4 /100 | #130 | Exceptional 28.4% |
| Immigrants | Austria | 90.3 /100 | #131 | Exceptional 28.4% |
| Immigrants | Morocco | 89.5 /100 | #132 | Excellent 28.4% |
| Swedes | 89.4 /100 | #133 | Excellent 28.4% |
| Immigrants | Southern Europe | 89.2 /100 | #134 | Excellent 28.4% |
| Immigrants | Spain | 89.2 /100 | #135 | Excellent 28.4% |
| Native Hawaiians | 88.9 /100 | #136 | Excellent 28.4% |
| Immigrants | Canada | 88.9 /100 | #137 | Excellent 28.4% |
| Immigrants | Belgium | 88.5 /100 | #138 | Excellent 28.5% |