White/Caucasian vs Immigrants from Uruguay Single Mother Poverty
COMPARE
White/Caucasian
Immigrants from Uruguay
Single Mother Poverty
Single Mother Poverty Comparison
Whites/Caucasians
Immigrants from Uruguay
31.2%
SINGLE MOTHER POVERTY
0.3/ 100
METRIC RATING
260th/ 347
METRIC RANK
29.1%
SINGLE MOTHER POVERTY
57.2/ 100
METRIC RATING
169th/ 347
METRIC RANK
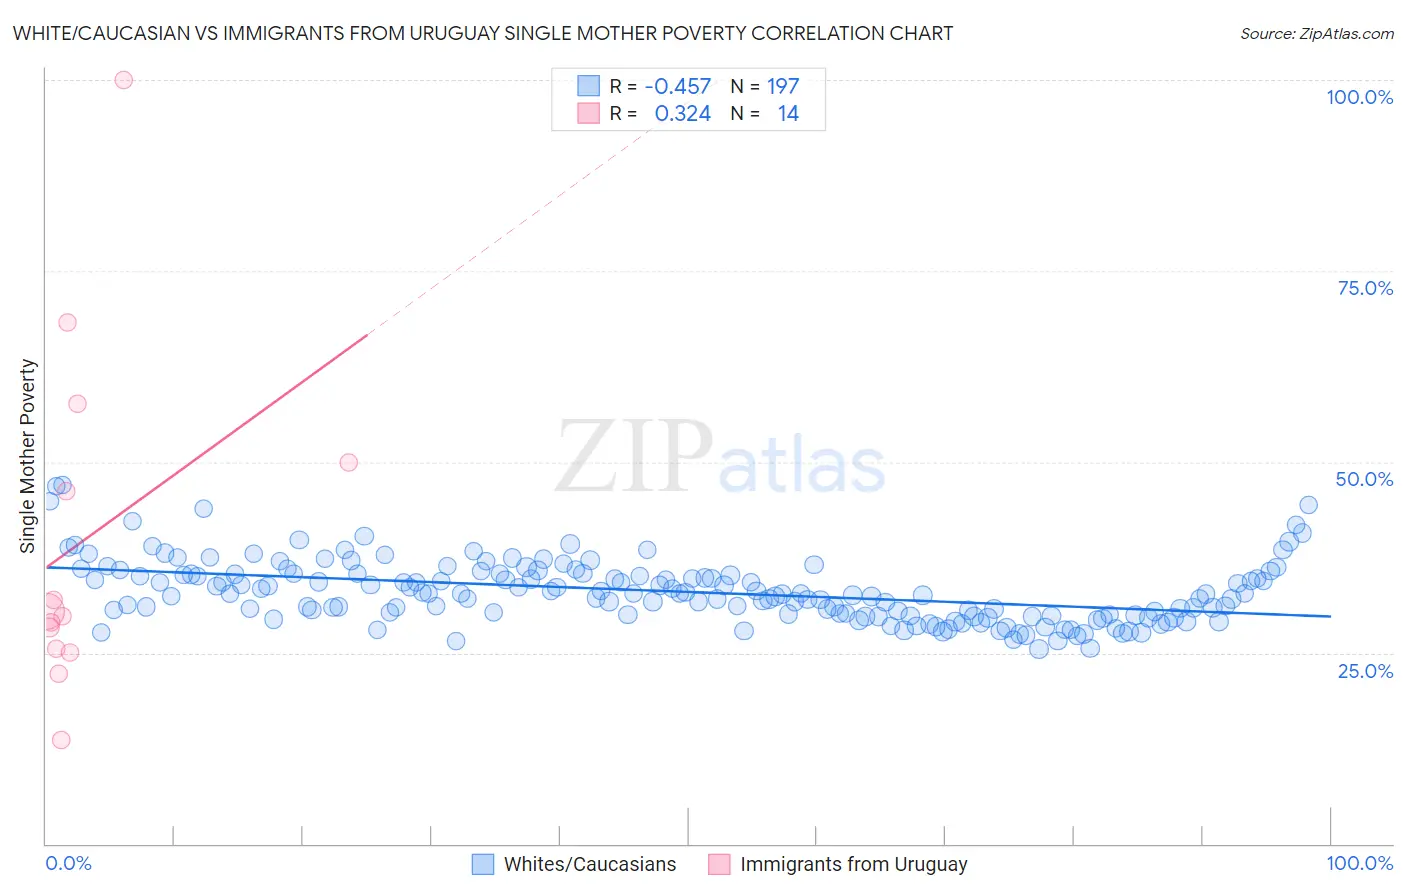
White/Caucasian vs Immigrants from Uruguay Single Mother Poverty Correlation Chart
The statistical analysis conducted on geographies consisting of 551,530,681 people shows a moderate negative correlation between the proportion of Whites/Caucasians and poverty level among single mothers in the United States with a correlation coefficient (R) of -0.457 and weighted average of 31.2%. Similarly, the statistical analysis conducted on geographies consisting of 131,793,407 people shows a mild positive correlation between the proportion of Immigrants from Uruguay and poverty level among single mothers in the United States with a correlation coefficient (R) of 0.324 and weighted average of 29.1%, a difference of 7.3%.
Single Mother Poverty Correlation Summary
| Measurement | White/Caucasian | Immigrants from Uruguay |
| Minimum | 25.5% | 13.7% |
| Maximum | 47.0% | 100.0% |
| Range | 21.5% | 86.3% |
| Mean | 33.0% | 39.9% |
| Median | 32.7% | 30.1% |
| Interquartile 25% (IQ1) | 29.9% | 25.6% |
| Interquartile 75% (IQ3) | 35.3% | 50.0% |
| Interquartile Range (IQR) | 5.4% | 24.4% |
| Standard Deviation (Sample) | 4.0% | 22.9% |
| Standard Deviation (Population) | 4.0% | 22.1% |
Similar Demographics by Single Mother Poverty
Demographics Similar to Whites/Caucasians by Single Mother Poverty
In terms of single mother poverty, the demographic groups most similar to Whites/Caucasians are Immigrants from El Salvador (31.2%, a difference of 0.080%), Immigrants from Bangladesh (31.1%, a difference of 0.16%), Immigrants from Caribbean (31.1%, a difference of 0.19%), Hmong (31.2%, a difference of 0.21%), and Immigrants from Bahamas (31.1%, a difference of 0.28%).
| Demographics | Rating | Rank | Single Mother Poverty |
| Celtics | 0.6 /100 | #253 | Tragic 30.9% |
| Senegalese | 0.5 /100 | #254 | Tragic 31.0% |
| Belizeans | 0.5 /100 | #255 | Tragic 31.0% |
| Immigrants | West Indies | 0.4 /100 | #256 | Tragic 31.1% |
| Immigrants | Bahamas | 0.4 /100 | #257 | Tragic 31.1% |
| Immigrants | Caribbean | 0.4 /100 | #258 | Tragic 31.1% |
| Immigrants | Bangladesh | 0.4 /100 | #259 | Tragic 31.1% |
| Whites/Caucasians | 0.3 /100 | #260 | Tragic 31.2% |
| Immigrants | El Salvador | 0.3 /100 | #261 | Tragic 31.2% |
| Hmong | 0.3 /100 | #262 | Tragic 31.2% |
| Bahamians | 0.2 /100 | #263 | Tragic 31.3% |
| Immigrants | Ecuador | 0.2 /100 | #264 | Tragic 31.3% |
| German Russians | 0.2 /100 | #265 | Tragic 31.3% |
| Sub-Saharan Africans | 0.2 /100 | #266 | Tragic 31.4% |
| Immigrants | Belize | 0.2 /100 | #267 | Tragic 31.4% |
Demographics Similar to Immigrants from Uruguay by Single Mother Poverty
In terms of single mother poverty, the demographic groups most similar to Immigrants from Uruguay are European (29.1%, a difference of 0.020%), Costa Rican (29.0%, a difference of 0.060%), New Zealander (29.1%, a difference of 0.10%), Puget Sound Salish (29.1%, a difference of 0.11%), and Inupiat (29.0%, a difference of 0.16%).
| Demographics | Rating | Rank | Single Mother Poverty |
| Scandinavians | 66.2 /100 | #162 | Good 28.9% |
| Immigrants | Nigeria | 65.9 /100 | #163 | Good 28.9% |
| Immigrants | Kenya | 65.9 /100 | #164 | Good 28.9% |
| Arabs | 60.7 /100 | #165 | Good 29.0% |
| Inupiat | 60.4 /100 | #166 | Good 29.0% |
| Costa Ricans | 58.4 /100 | #167 | Average 29.0% |
| Europeans | 57.6 /100 | #168 | Average 29.1% |
| Immigrants | Uruguay | 57.2 /100 | #169 | Average 29.1% |
| New Zealanders | 55.1 /100 | #170 | Average 29.1% |
| Puget Sound Salish | 55.1 /100 | #171 | Average 29.1% |
| Carpatho Rusyns | 53.8 /100 | #172 | Average 29.1% |
| British | 50.6 /100 | #173 | Average 29.2% |
| Immigrants | Saudi Arabia | 50.0 /100 | #174 | Average 29.2% |
| Immigrants | Costa Rica | 48.8 /100 | #175 | Average 29.2% |
| Hawaiians | 47.8 /100 | #176 | Average 29.2% |