White/Caucasian vs Immigrants from Austria Single Mother Households
COMPARE
White/Caucasian
Immigrants from Austria
Single Mother Households
Single Mother Households Comparison
Whites/Caucasians
Immigrants from Austria
6.1%
SINGLE MOTHER HOUSEHOLDS
76.5/ 100
METRIC RATING
155th/ 347
METRIC RANK
5.2%
SINGLE MOTHER HOUSEHOLDS
99.8/ 100
METRIC RATING
23rd/ 347
METRIC RANK
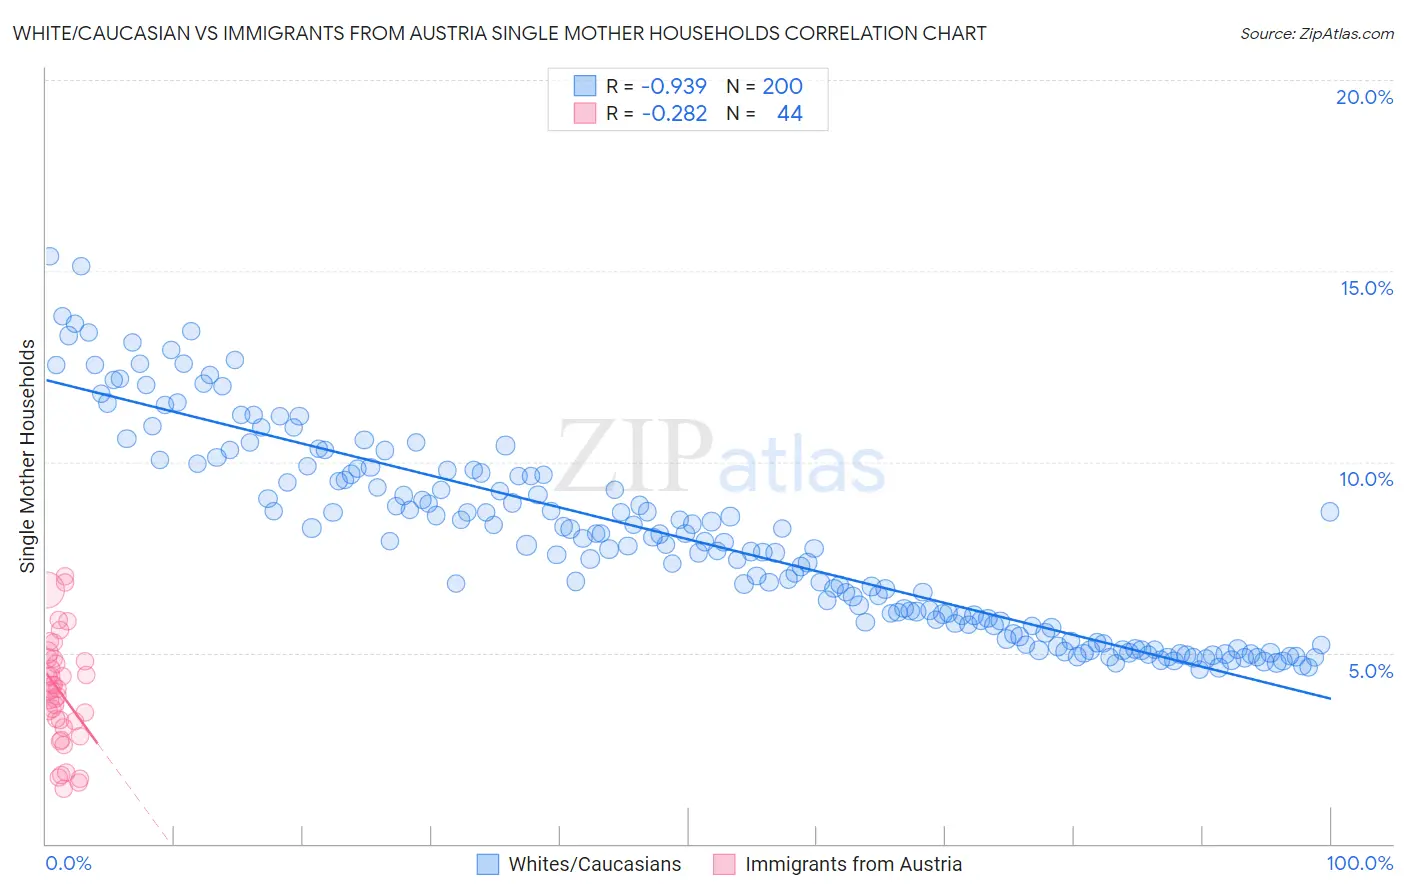
White/Caucasian vs Immigrants from Austria Single Mother Households Correlation Chart
The statistical analysis conducted on geographies consisting of 577,516,213 people shows a near-perfect negative correlation between the proportion of Whites/Caucasians and percentage of single mother households in the United States with a correlation coefficient (R) of -0.939 and weighted average of 6.1%. Similarly, the statistical analysis conducted on geographies consisting of 167,548,471 people shows a weak negative correlation between the proportion of Immigrants from Austria and percentage of single mother households in the United States with a correlation coefficient (R) of -0.282 and weighted average of 5.2%, a difference of 16.8%.
Single Mother Households Correlation Summary
| Measurement | White/Caucasian | Immigrants from Austria |
| Minimum | 4.6% | 1.5% |
| Maximum | 15.4% | 7.0% |
| Range | 10.8% | 5.6% |
| Mean | 8.0% | 4.0% |
| Median | 7.8% | 4.0% |
| Interquartile 25% (IQ1) | 5.7% | 3.1% |
| Interquartile 75% (IQ3) | 9.7% | 4.8% |
| Interquartile Range (IQR) | 4.0% | 1.7% |
| Standard Deviation (Sample) | 2.6% | 1.4% |
| Standard Deviation (Population) | 2.6% | 1.4% |
Similar Demographics by Single Mother Households
Demographics Similar to Whites/Caucasians by Single Mother Households
In terms of single mother households, the demographic groups most similar to Whites/Caucasians are Native Hawaiian (6.1%, a difference of 0.23%), Immigrants from Philippines (6.1%, a difference of 0.33%), Chilean (6.1%, a difference of 0.34%), Immigrants from Brazil (6.1%, a difference of 0.40%), and Pakistani (6.1%, a difference of 0.44%).
| Demographics | Rating | Rank | Single Mother Households |
| Scotch-Irish | 82.0 /100 | #148 | Excellent 6.0% |
| Immigrants | Albania | 81.5 /100 | #149 | Excellent 6.1% |
| Zimbabweans | 80.7 /100 | #150 | Excellent 6.1% |
| Immigrants | Southern Europe | 80.5 /100 | #151 | Excellent 6.1% |
| Pakistanis | 79.2 /100 | #152 | Good 6.1% |
| Immigrants | Brazil | 78.9 /100 | #153 | Good 6.1% |
| Immigrants | Philippines | 78.5 /100 | #154 | Good 6.1% |
| Whites/Caucasians | 76.5 /100 | #155 | Good 6.1% |
| Native Hawaiians | 75.0 /100 | #156 | Good 6.1% |
| Chileans | 74.2 /100 | #157 | Good 6.1% |
| Celtics | 73.3 /100 | #158 | Good 6.1% |
| Yugoslavians | 73.1 /100 | #159 | Good 6.1% |
| Iraqis | 73.0 /100 | #160 | Good 6.1% |
| Immigrants | Germany | 72.4 /100 | #161 | Good 6.1% |
| Immigrants | Zimbabwe | 69.9 /100 | #162 | Good 6.2% |
Demographics Similar to Immigrants from Austria by Single Mother Households
In terms of single mother households, the demographic groups most similar to Immigrants from Austria are Thai (5.2%, a difference of 0.050%), Armenian (5.2%, a difference of 0.060%), Immigrants from Japan (5.2%, a difference of 0.39%), Immigrants from Lithuania (5.3%, a difference of 0.42%), and Eastern European (5.2%, a difference of 0.77%).
| Demographics | Rating | Rank | Single Mother Households |
| Indians (Asian) | 99.9 /100 | #16 | Exceptional 5.1% |
| Soviet Union | 99.9 /100 | #17 | Exceptional 5.1% |
| Immigrants | Armenia | 99.9 /100 | #18 | Exceptional 5.2% |
| Chinese | 99.9 /100 | #19 | Exceptional 5.2% |
| Maltese | 99.9 /100 | #20 | Exceptional 5.2% |
| Eastern Europeans | 99.8 /100 | #21 | Exceptional 5.2% |
| Thais | 99.8 /100 | #22 | Exceptional 5.2% |
| Immigrants | Austria | 99.8 /100 | #23 | Exceptional 5.2% |
| Armenians | 99.8 /100 | #24 | Exceptional 5.2% |
| Immigrants | Japan | 99.8 /100 | #25 | Exceptional 5.2% |
| Immigrants | Lithuania | 99.8 /100 | #26 | Exceptional 5.3% |
| Bhutanese | 99.7 /100 | #27 | Exceptional 5.3% |
| Russians | 99.7 /100 | #28 | Exceptional 5.3% |
| Latvians | 99.7 /100 | #29 | Exceptional 5.3% |
| Burmese | 99.7 /100 | #30 | Exceptional 5.3% |