White/Caucasian vs Welsh Single Mother Poverty
COMPARE
White/Caucasian
Welsh
Single Mother Poverty
Single Mother Poverty Comparison
Whites/Caucasians
Welsh
31.2%
SINGLE MOTHER POVERTY
0.3/ 100
METRIC RATING
260th/ 347
METRIC RANK
30.4%
SINGLE MOTHER POVERTY
3.2/ 100
METRIC RATING
236th/ 347
METRIC RANK
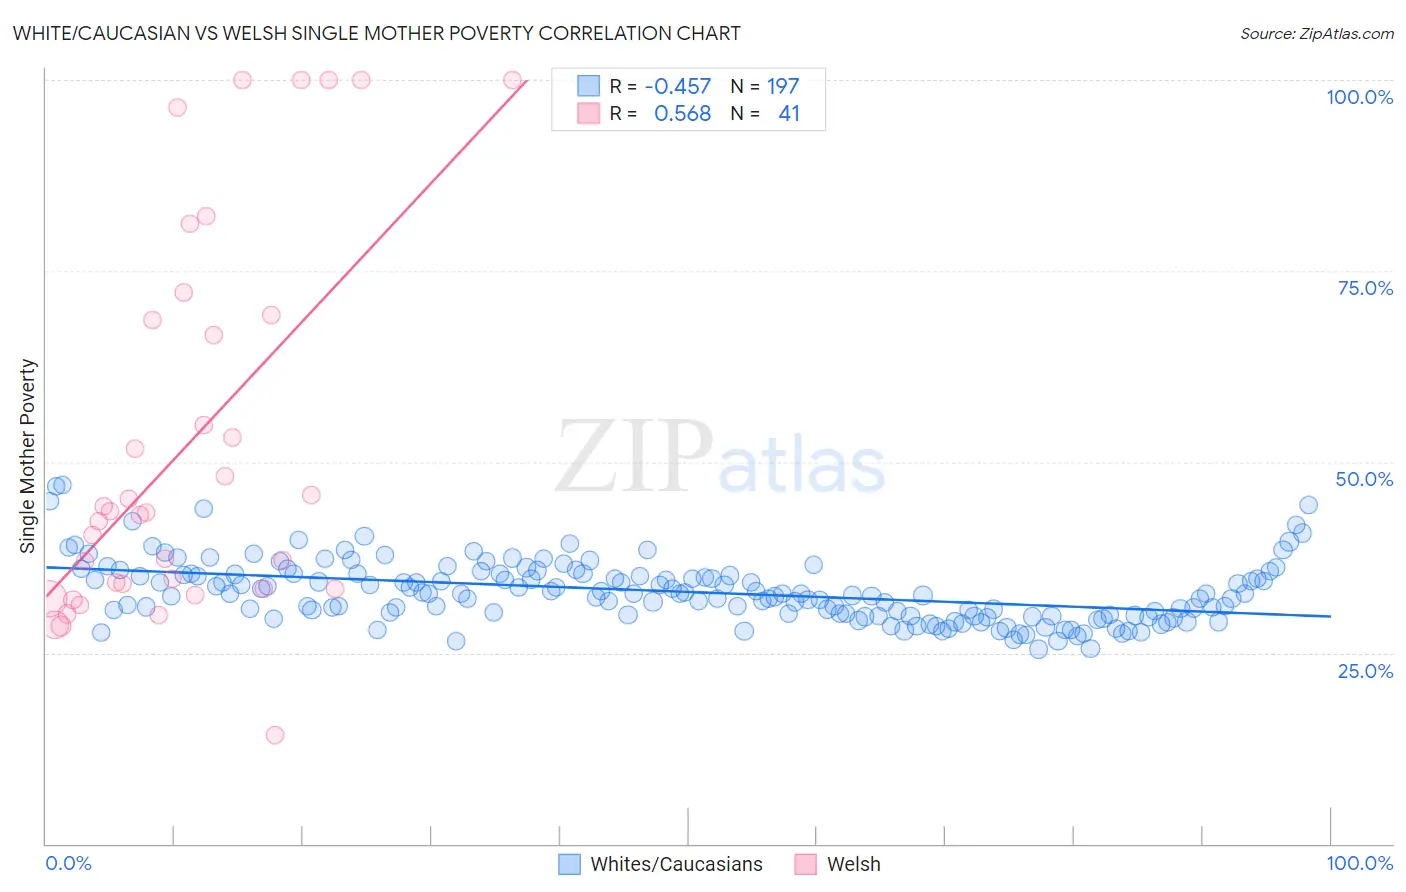
White/Caucasian vs Welsh Single Mother Poverty Correlation Chart
The statistical analysis conducted on geographies consisting of 551,530,681 people shows a moderate negative correlation between the proportion of Whites/Caucasians and poverty level among single mothers in the United States with a correlation coefficient (R) of -0.457 and weighted average of 31.2%. Similarly, the statistical analysis conducted on geographies consisting of 506,398,542 people shows a substantial positive correlation between the proportion of Welsh and poverty level among single mothers in the United States with a correlation coefficient (R) of 0.568 and weighted average of 30.4%, a difference of 2.7%.
Single Mother Poverty Correlation Summary
| Measurement | White/Caucasian | Welsh |
| Minimum | 25.5% | 14.3% |
| Maximum | 47.0% | 100.0% |
| Range | 21.5% | 85.7% |
| Mean | 33.0% | 52.0% |
| Median | 32.7% | 43.3% |
| Interquartile 25% (IQ1) | 29.9% | 33.3% |
| Interquartile 75% (IQ3) | 35.3% | 68.9% |
| Interquartile Range (IQR) | 5.4% | 35.6% |
| Standard Deviation (Sample) | 4.0% | 24.7% |
| Standard Deviation (Population) | 4.0% | 24.4% |
Similar Demographics by Single Mother Poverty
Demographics Similar to Whites/Caucasians by Single Mother Poverty
In terms of single mother poverty, the demographic groups most similar to Whites/Caucasians are Immigrants from El Salvador (31.2%, a difference of 0.080%), Immigrants from Bangladesh (31.1%, a difference of 0.16%), Immigrants from Caribbean (31.1%, a difference of 0.19%), Hmong (31.2%, a difference of 0.21%), and Immigrants from Bahamas (31.1%, a difference of 0.28%).
| Demographics | Rating | Rank | Single Mother Poverty |
| Celtics | 0.6 /100 | #253 | Tragic 30.9% |
| Senegalese | 0.5 /100 | #254 | Tragic 31.0% |
| Belizeans | 0.5 /100 | #255 | Tragic 31.0% |
| Immigrants | West Indies | 0.4 /100 | #256 | Tragic 31.1% |
| Immigrants | Bahamas | 0.4 /100 | #257 | Tragic 31.1% |
| Immigrants | Caribbean | 0.4 /100 | #258 | Tragic 31.1% |
| Immigrants | Bangladesh | 0.4 /100 | #259 | Tragic 31.1% |
| Whites/Caucasians | 0.3 /100 | #260 | Tragic 31.2% |
| Immigrants | El Salvador | 0.3 /100 | #261 | Tragic 31.2% |
| Hmong | 0.3 /100 | #262 | Tragic 31.2% |
| Bahamians | 0.2 /100 | #263 | Tragic 31.3% |
| Immigrants | Ecuador | 0.2 /100 | #264 | Tragic 31.3% |
| German Russians | 0.2 /100 | #265 | Tragic 31.3% |
| Sub-Saharan Africans | 0.2 /100 | #266 | Tragic 31.4% |
| Immigrants | Belize | 0.2 /100 | #267 | Tragic 31.4% |
Demographics Similar to Welsh by Single Mother Poverty
In terms of single mother poverty, the demographic groups most similar to Welsh are Immigrants from St. Vincent and the Grenadines (30.4%, a difference of 0.050%), Immigrants from Grenada (30.3%, a difference of 0.070%), Immigrants from Middle Africa (30.3%, a difference of 0.10%), Immigrants from Nicaragua (30.3%, a difference of 0.10%), and Slovak (30.4%, a difference of 0.16%).
| Demographics | Rating | Rank | Single Mother Poverty |
| Immigrants | Barbados | 5.0 /100 | #229 | Tragic 30.2% |
| English | 4.8 /100 | #230 | Tragic 30.2% |
| Dutch | 4.3 /100 | #231 | Tragic 30.2% |
| Alaskan Athabascans | 4.1 /100 | #232 | Tragic 30.3% |
| Immigrants | Middle Africa | 3.5 /100 | #233 | Tragic 30.3% |
| Immigrants | Nicaragua | 3.5 /100 | #234 | Tragic 30.3% |
| Immigrants | Grenada | 3.4 /100 | #235 | Tragic 30.3% |
| Welsh | 3.2 /100 | #236 | Tragic 30.4% |
| Immigrants | St. Vincent and the Grenadines | 3.1 /100 | #237 | Tragic 30.4% |
| Slovaks | 2.8 /100 | #238 | Tragic 30.4% |
| Immigrants | Portugal | 2.1 /100 | #239 | Tragic 30.5% |
| Salvadorans | 1.8 /100 | #240 | Tragic 30.6% |
| Immigrants | Laos | 1.8 /100 | #241 | Tragic 30.6% |
| Immigrants | Burma/Myanmar | 1.7 /100 | #242 | Tragic 30.6% |
| Bermudans | 1.6 /100 | #243 | Tragic 30.6% |