White/Caucasian vs Immigrants from Austria 9th Grade
COMPARE
White/Caucasian
Immigrants from Austria
9th Grade
9th Grade Comparison
Whites/Caucasians
Immigrants from Austria
95.8%
9TH GRADE
99.4/ 100
METRIC RATING
77th/ 347
METRIC RANK
96.0%
9TH GRADE
99.8/ 100
METRIC RATING
55th/ 347
METRIC RANK
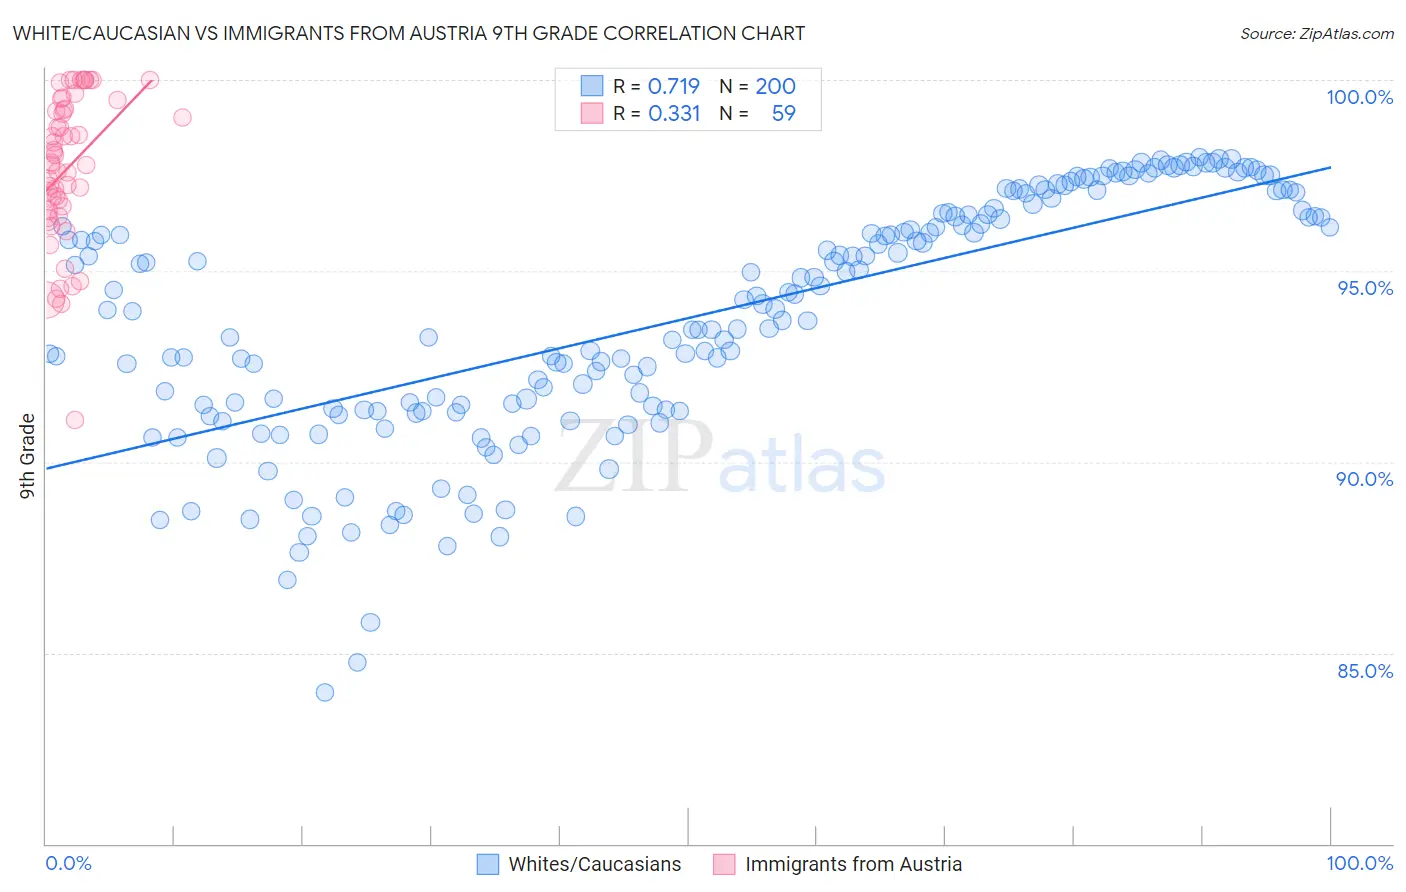
White/Caucasian vs Immigrants from Austria 9th Grade Correlation Chart
The statistical analysis conducted on geographies consisting of 585,245,517 people shows a strong positive correlation between the proportion of Whites/Caucasians and percentage of population with at least 9th grade education in the United States with a correlation coefficient (R) of 0.719 and weighted average of 95.8%. Similarly, the statistical analysis conducted on geographies consisting of 167,973,751 people shows a mild positive correlation between the proportion of Immigrants from Austria and percentage of population with at least 9th grade education in the United States with a correlation coefficient (R) of 0.331 and weighted average of 96.0%, a difference of 0.21%.
9th Grade Correlation Summary
| Measurement | White/Caucasian | Immigrants from Austria |
| Minimum | 84.0% | 91.1% |
| Maximum | 98.0% | 100.0% |
| Range | 14.0% | 8.9% |
| Mean | 93.8% | 97.7% |
| Median | 94.1% | 97.8% |
| Interquartile 25% (IQ1) | 91.4% | 96.6% |
| Interquartile 75% (IQ3) | 96.5% | 99.2% |
| Interquartile Range (IQR) | 5.1% | 2.7% |
| Standard Deviation (Sample) | 3.2% | 1.9% |
| Standard Deviation (Population) | 3.2% | 1.9% |
Similar Demographics by 9th Grade
Demographics Similar to Whites/Caucasians by 9th Grade
In terms of 9th grade, the demographic groups most similar to Whites/Caucasians are Immigrants from South Africa (95.8%, a difference of 0.0%), Inupiat (95.8%, a difference of 0.010%), Immigrants from Sweden (95.8%, a difference of 0.010%), Thai (95.8%, a difference of 0.020%), and Immigrants from Belgium (95.8%, a difference of 0.030%).
| Demographics | Rating | Rank | 9th Grade |
| Immigrants | Australia | 99.5 /100 | #70 | Exceptional 95.8% |
| Immigrants | Belgium | 99.5 /100 | #71 | Exceptional 95.8% |
| Turks | 99.5 /100 | #72 | Exceptional 95.8% |
| Immigrants | Singapore | 99.5 /100 | #73 | Exceptional 95.8% |
| Thais | 99.5 /100 | #74 | Exceptional 95.8% |
| Inupiat | 99.5 /100 | #75 | Exceptional 95.8% |
| Immigrants | Sweden | 99.5 /100 | #76 | Exceptional 95.8% |
| Whites/Caucasians | 99.4 /100 | #77 | Exceptional 95.8% |
| Immigrants | South Africa | 99.4 /100 | #78 | Exceptional 95.8% |
| Romanians | 99.3 /100 | #79 | Exceptional 95.7% |
| Bhutanese | 99.3 /100 | #80 | Exceptional 95.7% |
| Arapaho | 99.3 /100 | #81 | Exceptional 95.7% |
| Puget Sound Salish | 99.2 /100 | #82 | Exceptional 95.7% |
| Swiss | 99.2 /100 | #83 | Exceptional 95.7% |
| Immigrants | Denmark | 99.1 /100 | #84 | Exceptional 95.7% |
Demographics Similar to Immigrants from Austria by 9th Grade
In terms of 9th grade, the demographic groups most similar to Immigrants from Austria are Immigrants from North America (96.0%, a difference of 0.0%), Immigrants from Canada (96.0%, a difference of 0.010%), Macedonian (96.0%, a difference of 0.010%), Aleut (96.0%, a difference of 0.010%), and Austrian (96.0%, a difference of 0.020%).
| Demographics | Rating | Rank | 9th Grade |
| Australians | 99.9 /100 | #48 | Exceptional 96.0% |
| Greeks | 99.9 /100 | #49 | Exceptional 96.0% |
| Celtics | 99.9 /100 | #50 | Exceptional 96.0% |
| Immigrants | Northern Europe | 99.9 /100 | #51 | Exceptional 96.0% |
| Serbians | 99.9 /100 | #52 | Exceptional 96.0% |
| Austrians | 99.8 /100 | #53 | Exceptional 96.0% |
| Immigrants | Canada | 99.8 /100 | #54 | Exceptional 96.0% |
| Immigrants | Austria | 99.8 /100 | #55 | Exceptional 96.0% |
| Immigrants | North America | 99.8 /100 | #56 | Exceptional 96.0% |
| Macedonians | 99.8 /100 | #57 | Exceptional 96.0% |
| Aleuts | 99.8 /100 | #58 | Exceptional 96.0% |
| New Zealanders | 99.8 /100 | #59 | Exceptional 95.9% |
| Native Hawaiians | 99.8 /100 | #60 | Exceptional 95.9% |
| Sioux | 99.8 /100 | #61 | Exceptional 95.9% |
| Ukrainians | 99.7 /100 | #62 | Exceptional 95.9% |