Immigrants from El Salvador vs Immigrants from Austria Single Mother Poverty
COMPARE
Immigrants from El Salvador
Immigrants from Austria
Single Mother Poverty
Single Mother Poverty Comparison
Immigrants from El Salvador
Immigrants from Austria
31.2%
SINGLE MOTHER POVERTY
0.3/ 100
METRIC RATING
261st/ 347
METRIC RANK
28.4%
SINGLE MOTHER POVERTY
90.3/ 100
METRIC RATING
131st/ 347
METRIC RANK
Immigrants from El Salvador vs Immigrants from Austria Single Mother Poverty Correlation Chart
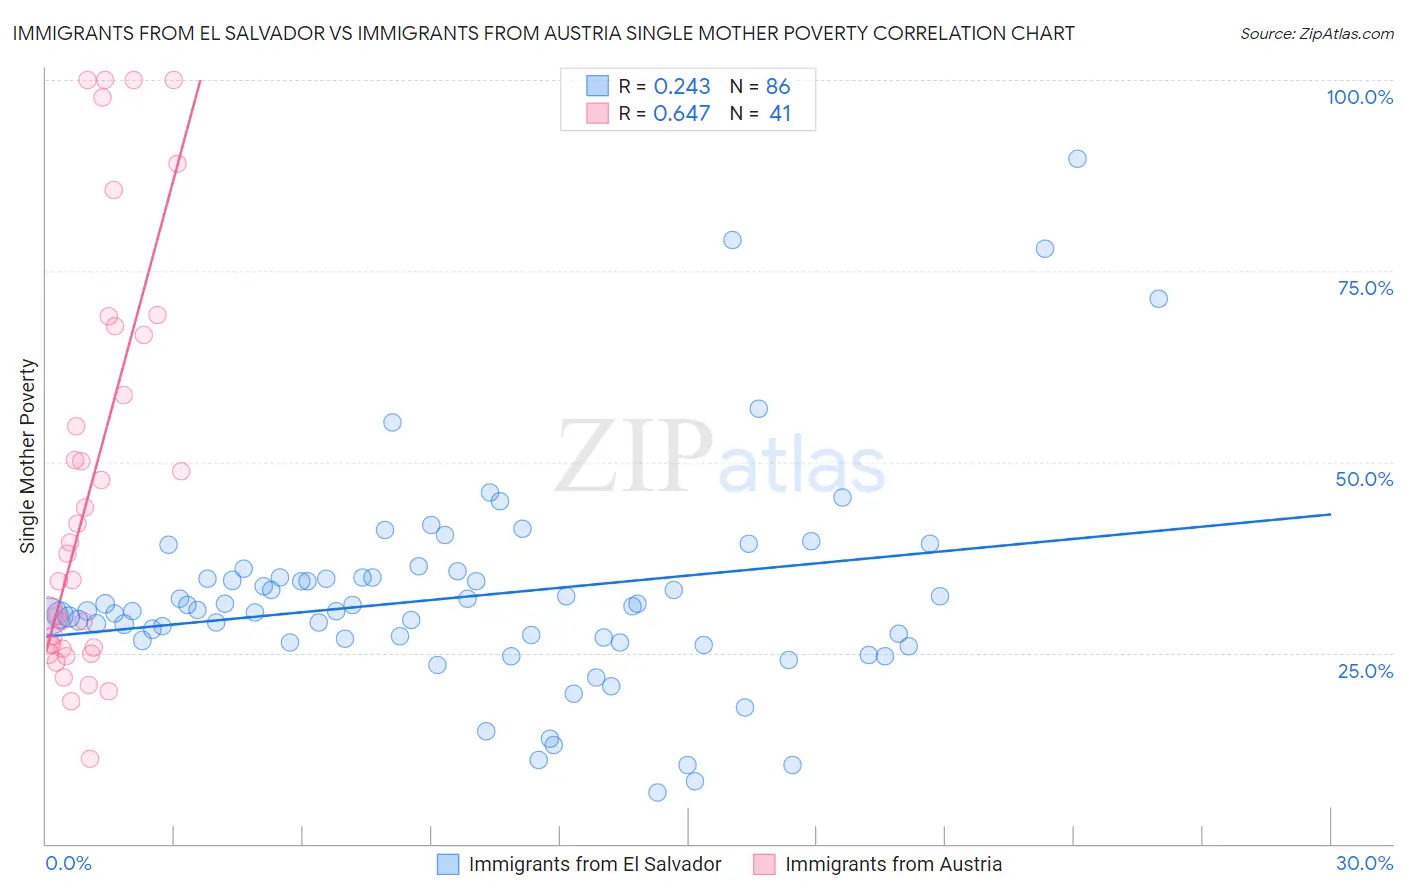
The statistical analysis conducted on geographies consisting of 352,610,814 people shows a weak positive correlation between the proportion of Immigrants from El Salvador and poverty level among single mothers in the United States with a correlation coefficient (R) of 0.243 and weighted average of 31.2%. Similarly, the statistical analysis conducted on geographies consisting of 164,839,787 people shows a significant positive correlation between the proportion of Immigrants from Austria and poverty level among single mothers in the United States with a correlation coefficient (R) of 0.647 and weighted average of 28.4%, a difference of 9.9%.
Single Mother Poverty Correlation Summary
| Measurement | Immigrants from El Salvador | Immigrants from Austria |
| Minimum | 6.7% | 11.1% |
| Maximum | 89.6% | 100.0% |
| Range | 83.0% | 88.9% |
| Mean | 32.4% | 47.0% |
| Median | 30.6% | 38.0% |
| Interquartile 25% (IQ1) | 26.6% | 25.6% |
| Interquartile 75% (IQ3) | 34.8% | 67.2% |
| Interquartile Range (IQR) | 8.2% | 41.6% |
| Standard Deviation (Sample) | 13.9% | 27.0% |
| Standard Deviation (Population) | 13.8% | 26.7% |
Similar Demographics by Single Mother Poverty
Demographics Similar to Immigrants from El Salvador by Single Mother Poverty
In terms of single mother poverty, the demographic groups most similar to Immigrants from El Salvador are White/Caucasian (31.2%, a difference of 0.080%), Hmong (31.2%, a difference of 0.14%), Immigrants from Bangladesh (31.1%, a difference of 0.23%), Immigrants from Caribbean (31.1%, a difference of 0.27%), and Immigrants from Bahamas (31.1%, a difference of 0.35%).
| Demographics | Rating | Rank | Single Mother Poverty |
| Senegalese | 0.5 /100 | #254 | Tragic 31.0% |
| Belizeans | 0.5 /100 | #255 | Tragic 31.0% |
| Immigrants | West Indies | 0.4 /100 | #256 | Tragic 31.1% |
| Immigrants | Bahamas | 0.4 /100 | #257 | Tragic 31.1% |
| Immigrants | Caribbean | 0.4 /100 | #258 | Tragic 31.1% |
| Immigrants | Bangladesh | 0.4 /100 | #259 | Tragic 31.1% |
| Whites/Caucasians | 0.3 /100 | #260 | Tragic 31.2% |
| Immigrants | El Salvador | 0.3 /100 | #261 | Tragic 31.2% |
| Hmong | 0.3 /100 | #262 | Tragic 31.2% |
| Bahamians | 0.2 /100 | #263 | Tragic 31.3% |
| Immigrants | Ecuador | 0.2 /100 | #264 | Tragic 31.3% |
| German Russians | 0.2 /100 | #265 | Tragic 31.3% |
| Sub-Saharan Africans | 0.2 /100 | #266 | Tragic 31.4% |
| Immigrants | Belize | 0.2 /100 | #267 | Tragic 31.4% |
| Immigrants | Senegal | 0.1 /100 | #268 | Tragic 31.5% |
Demographics Similar to Immigrants from Austria by Single Mother Poverty
In terms of single mother poverty, the demographic groups most similar to Immigrants from Austria are Norwegian (28.4%, a difference of 0.010%), South American (28.4%, a difference of 0.020%), Immigrants from England (28.4%, a difference of 0.040%), Polish (28.4%, a difference of 0.070%), and Immigrants from Chile (28.4%, a difference of 0.080%).
| Demographics | Rating | Rank | Single Mother Poverty |
| Immigrants | Switzerland | 91.7 /100 | #124 | Exceptional 28.3% |
| Kenyans | 90.9 /100 | #125 | Exceptional 28.4% |
| Immigrants | Chile | 90.8 /100 | #126 | Exceptional 28.4% |
| Poles | 90.8 /100 | #127 | Exceptional 28.4% |
| Immigrants | England | 90.5 /100 | #128 | Exceptional 28.4% |
| South Americans | 90.4 /100 | #129 | Exceptional 28.4% |
| Norwegians | 90.4 /100 | #130 | Exceptional 28.4% |
| Immigrants | Austria | 90.3 /100 | #131 | Exceptional 28.4% |
| Immigrants | Morocco | 89.5 /100 | #132 | Excellent 28.4% |
| Swedes | 89.4 /100 | #133 | Excellent 28.4% |
| Immigrants | Southern Europe | 89.2 /100 | #134 | Excellent 28.4% |
| Immigrants | Spain | 89.2 /100 | #135 | Excellent 28.4% |
| Native Hawaiians | 88.9 /100 | #136 | Excellent 28.4% |
| Immigrants | Canada | 88.9 /100 | #137 | Excellent 28.4% |
| Immigrants | Belgium | 88.5 /100 | #138 | Excellent 28.5% |