Immigrants from Poland vs Immigrants from Austria Single Mother Poverty
COMPARE
Immigrants from Poland
Immigrants from Austria
Single Mother Poverty
Single Mother Poverty Comparison
Immigrants from Poland
Immigrants from Austria
26.9%
SINGLE MOTHER POVERTY
99.8/ 100
METRIC RATING
48th/ 347
METRIC RANK
28.4%
SINGLE MOTHER POVERTY
90.3/ 100
METRIC RATING
131st/ 347
METRIC RANK
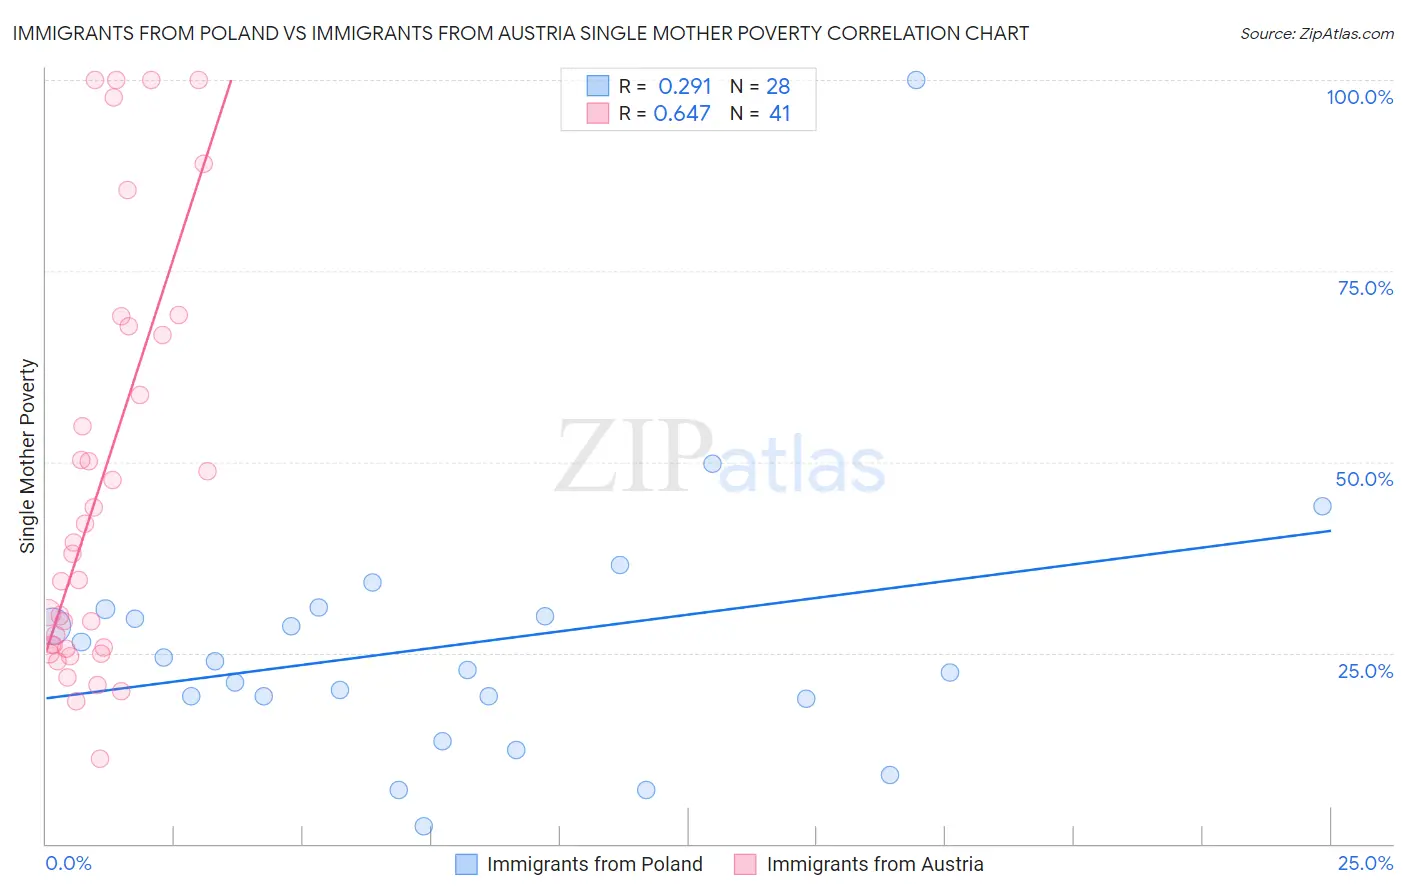
Immigrants from Poland vs Immigrants from Austria Single Mother Poverty Correlation Chart
The statistical analysis conducted on geographies consisting of 296,747,153 people shows a weak positive correlation between the proportion of Immigrants from Poland and poverty level among single mothers in the United States with a correlation coefficient (R) of 0.291 and weighted average of 26.9%. Similarly, the statistical analysis conducted on geographies consisting of 164,839,787 people shows a significant positive correlation between the proportion of Immigrants from Austria and poverty level among single mothers in the United States with a correlation coefficient (R) of 0.647 and weighted average of 28.4%, a difference of 5.4%.
Single Mother Poverty Correlation Summary
| Measurement | Immigrants from Poland | Immigrants from Austria |
| Minimum | 2.2% | 11.1% |
| Maximum | 100.0% | 100.0% |
| Range | 97.8% | 88.9% |
| Mean | 26.1% | 47.0% |
| Median | 23.3% | 38.0% |
| Interquartile 25% (IQ1) | 19.2% | 25.6% |
| Interquartile 75% (IQ3) | 30.2% | 67.2% |
| Interquartile Range (IQR) | 11.1% | 41.6% |
| Standard Deviation (Sample) | 18.1% | 27.0% |
| Standard Deviation (Population) | 17.7% | 26.7% |
Similar Demographics by Single Mother Poverty
Demographics Similar to Immigrants from Poland by Single Mother Poverty
In terms of single mother poverty, the demographic groups most similar to Immigrants from Poland are Egyptian (26.9%, a difference of 0.080%), Cambodian (27.0%, a difference of 0.080%), Laotian (27.0%, a difference of 0.090%), Immigrants from Serbia (26.9%, a difference of 0.13%), and Latvian (26.9%, a difference of 0.18%).
| Demographics | Rating | Rank | Single Mother Poverty |
| Immigrants | Greece | 99.9 /100 | #41 | Exceptional 26.7% |
| Armenians | 99.9 /100 | #42 | Exceptional 26.8% |
| Tsimshian | 99.9 /100 | #43 | Exceptional 26.8% |
| Immigrants | Sierra Leone | 99.9 /100 | #44 | Exceptional 26.9% |
| Latvians | 99.9 /100 | #45 | Exceptional 26.9% |
| Immigrants | Serbia | 99.9 /100 | #46 | Exceptional 26.9% |
| Egyptians | 99.8 /100 | #47 | Exceptional 26.9% |
| Immigrants | Poland | 99.8 /100 | #48 | Exceptional 26.9% |
| Cambodians | 99.8 /100 | #49 | Exceptional 27.0% |
| Laotians | 99.8 /100 | #50 | Exceptional 27.0% |
| Immigrants | Argentina | 99.7 /100 | #51 | Exceptional 27.1% |
| Immigrants | South Eastern Asia | 99.7 /100 | #52 | Exceptional 27.1% |
| Immigrants | Jordan | 99.7 /100 | #53 | Exceptional 27.1% |
| Immigrants | Bulgaria | 99.7 /100 | #54 | Exceptional 27.1% |
| Immigrants | Egypt | 99.7 /100 | #55 | Exceptional 27.1% |
Demographics Similar to Immigrants from Austria by Single Mother Poverty
In terms of single mother poverty, the demographic groups most similar to Immigrants from Austria are Norwegian (28.4%, a difference of 0.010%), South American (28.4%, a difference of 0.020%), Immigrants from England (28.4%, a difference of 0.040%), Polish (28.4%, a difference of 0.070%), and Immigrants from Chile (28.4%, a difference of 0.080%).
| Demographics | Rating | Rank | Single Mother Poverty |
| Immigrants | Switzerland | 91.7 /100 | #124 | Exceptional 28.3% |
| Kenyans | 90.9 /100 | #125 | Exceptional 28.4% |
| Immigrants | Chile | 90.8 /100 | #126 | Exceptional 28.4% |
| Poles | 90.8 /100 | #127 | Exceptional 28.4% |
| Immigrants | England | 90.5 /100 | #128 | Exceptional 28.4% |
| South Americans | 90.4 /100 | #129 | Exceptional 28.4% |
| Norwegians | 90.4 /100 | #130 | Exceptional 28.4% |
| Immigrants | Austria | 90.3 /100 | #131 | Exceptional 28.4% |
| Immigrants | Morocco | 89.5 /100 | #132 | Excellent 28.4% |
| Swedes | 89.4 /100 | #133 | Excellent 28.4% |
| Immigrants | Southern Europe | 89.2 /100 | #134 | Excellent 28.4% |
| Immigrants | Spain | 89.2 /100 | #135 | Excellent 28.4% |
| Native Hawaiians | 88.9 /100 | #136 | Excellent 28.4% |
| Immigrants | Canada | 88.9 /100 | #137 | Excellent 28.4% |
| Immigrants | Belgium | 88.5 /100 | #138 | Excellent 28.5% |