West Indian vs Yuman Female Poverty
COMPARE
West Indian
Yuman
Female Poverty
Female Poverty Comparison
West Indians
Yuman
16.1%
FEMALE POVERTY
0.0/ 100
METRIC RATING
281st/ 347
METRIC RANK
20.8%
FEMALE POVERTY
0.0/ 100
METRIC RATING
337th/ 347
METRIC RANK
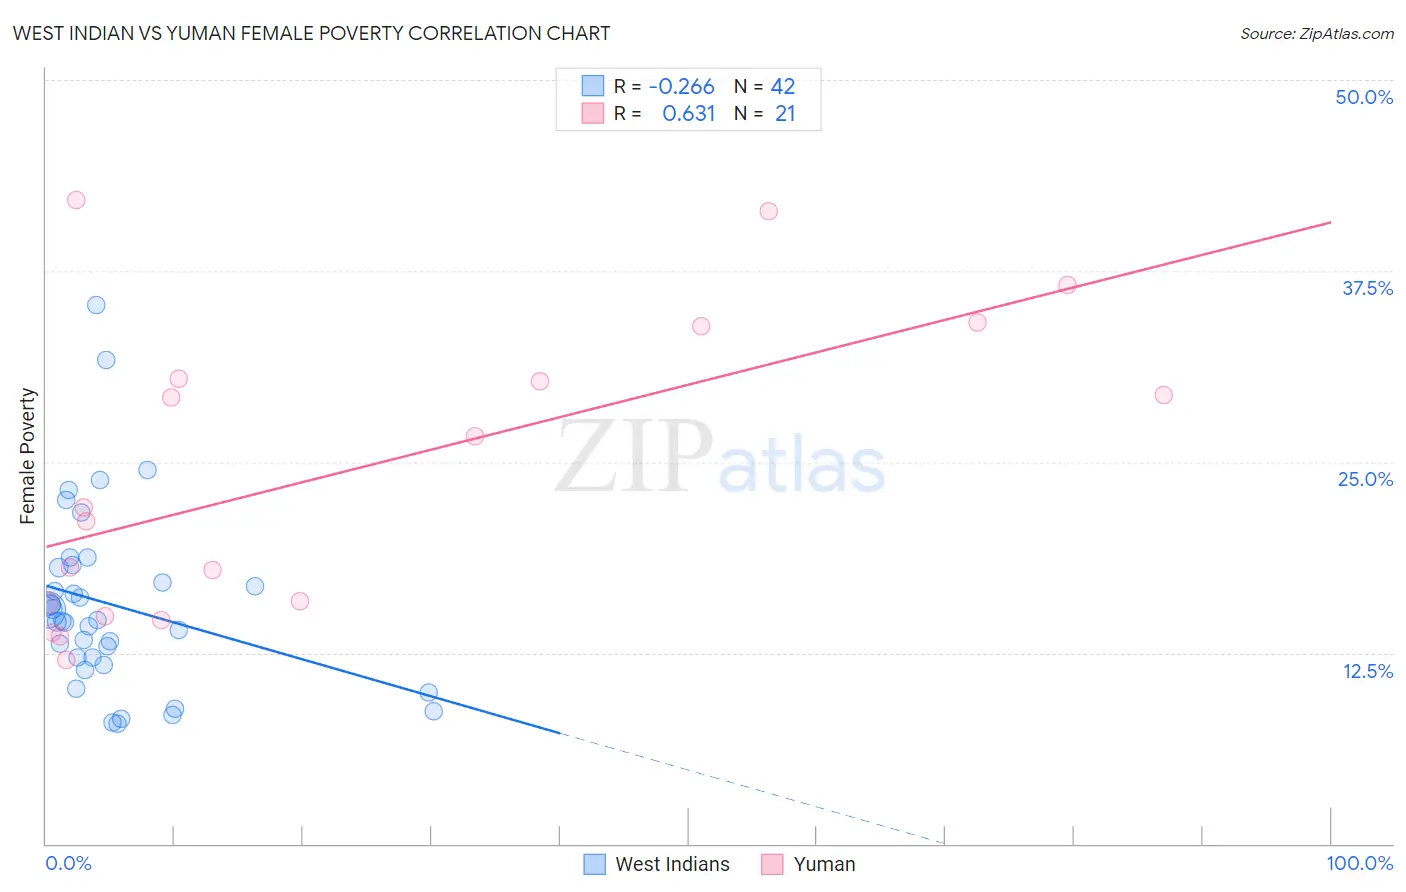
West Indian vs Yuman Female Poverty Correlation Chart
The statistical analysis conducted on geographies consisting of 253,850,168 people shows a weak negative correlation between the proportion of West Indians and poverty level among females in the United States with a correlation coefficient (R) of -0.266 and weighted average of 16.1%. Similarly, the statistical analysis conducted on geographies consisting of 40,663,290 people shows a significant positive correlation between the proportion of Yuman and poverty level among females in the United States with a correlation coefficient (R) of 0.631 and weighted average of 20.8%, a difference of 29.3%.
Female Poverty Correlation Summary
| Measurement | West Indian | Yuman |
| Minimum | 7.8% | 12.1% |
| Maximum | 35.3% | 42.1% |
| Range | 27.4% | 30.1% |
| Mean | 15.7% | 24.5% |
| Median | 14.6% | 22.0% |
| Interquartile 25% (IQ1) | 12.2% | 15.3% |
| Interquartile 75% (IQ3) | 18.1% | 32.2% |
| Interquartile Range (IQR) | 5.9% | 16.8% |
| Standard Deviation (Sample) | 5.9% | 9.7% |
| Standard Deviation (Population) | 5.9% | 9.5% |
Similar Demographics by Female Poverty
Demographics Similar to West Indians by Female Poverty
In terms of female poverty, the demographic groups most similar to West Indians are Vietnamese (16.1%, a difference of 0.020%), Immigrants from Haiti (16.1%, a difference of 0.15%), Immigrants from Cuba (16.1%, a difference of 0.24%), Immigrants from Bahamas (16.1%, a difference of 0.26%), and Spanish American (16.2%, a difference of 0.29%).
| Demographics | Rating | Rank | Female Poverty |
| Barbadians | 0.0 /100 | #274 | Tragic 15.9% |
| Immigrants | Barbados | 0.0 /100 | #275 | Tragic 16.0% |
| Central Americans | 0.0 /100 | #276 | Tragic 16.0% |
| Bangladeshis | 0.0 /100 | #277 | Tragic 16.0% |
| Immigrants | West Indies | 0.0 /100 | #278 | Tragic 16.1% |
| Immigrants | Bahamas | 0.0 /100 | #279 | Tragic 16.1% |
| Vietnamese | 0.0 /100 | #280 | Tragic 16.1% |
| West Indians | 0.0 /100 | #281 | Tragic 16.1% |
| Immigrants | Haiti | 0.0 /100 | #282 | Tragic 16.1% |
| Immigrants | Cuba | 0.0 /100 | #283 | Tragic 16.1% |
| Spanish Americans | 0.0 /100 | #284 | Tragic 16.2% |
| Comanche | 0.0 /100 | #285 | Tragic 16.2% |
| Inupiat | 0.0 /100 | #286 | Tragic 16.2% |
| Immigrants | Belize | 0.0 /100 | #287 | Tragic 16.3% |
| Indonesians | 0.0 /100 | #288 | Tragic 16.4% |
Demographics Similar to Yuman by Female Poverty
In terms of female poverty, the demographic groups most similar to Yuman are Sioux (20.9%, a difference of 0.19%), Hopi (21.0%, a difference of 0.56%), Pueblo (20.7%, a difference of 0.81%), Yup'ik (21.5%, a difference of 3.1%), and Cheyenne (20.2%, a difference of 3.2%).
| Demographics | Rating | Rank | Female Poverty |
| Dominicans | 0.0 /100 | #330 | Tragic 19.1% |
| Natives/Alaskans | 0.0 /100 | #331 | Tragic 19.2% |
| Apache | 0.0 /100 | #332 | Tragic 19.2% |
| Immigrants | Dominican Republic | 0.0 /100 | #333 | Tragic 19.3% |
| Houma | 0.0 /100 | #334 | Tragic 20.0% |
| Cheyenne | 0.0 /100 | #335 | Tragic 20.2% |
| Pueblo | 0.0 /100 | #336 | Tragic 20.7% |
| Yuman | 0.0 /100 | #337 | Tragic 20.8% |
| Sioux | 0.0 /100 | #338 | Tragic 20.9% |
| Hopi | 0.0 /100 | #339 | Tragic 21.0% |
| Yup'ik | 0.0 /100 | #340 | Tragic 21.5% |
| Crow | 0.0 /100 | #341 | Tragic 22.1% |
| Immigrants | Yemen | 0.0 /100 | #342 | Tragic 22.8% |
| Lumbee | 0.0 /100 | #343 | Tragic 23.5% |
| Pima | 0.0 /100 | #344 | Tragic 23.6% |