West Indian vs Immigrants from Scotland Female Poverty
COMPARE
West Indian
Immigrants from Scotland
Female Poverty
Female Poverty Comparison
West Indians
Immigrants from Scotland
16.1%
FEMALE POVERTY
0.0/ 100
METRIC RATING
281st/ 347
METRIC RANK
11.5%
FEMALE POVERTY
99.8/ 100
METRIC RATING
18th/ 347
METRIC RANK
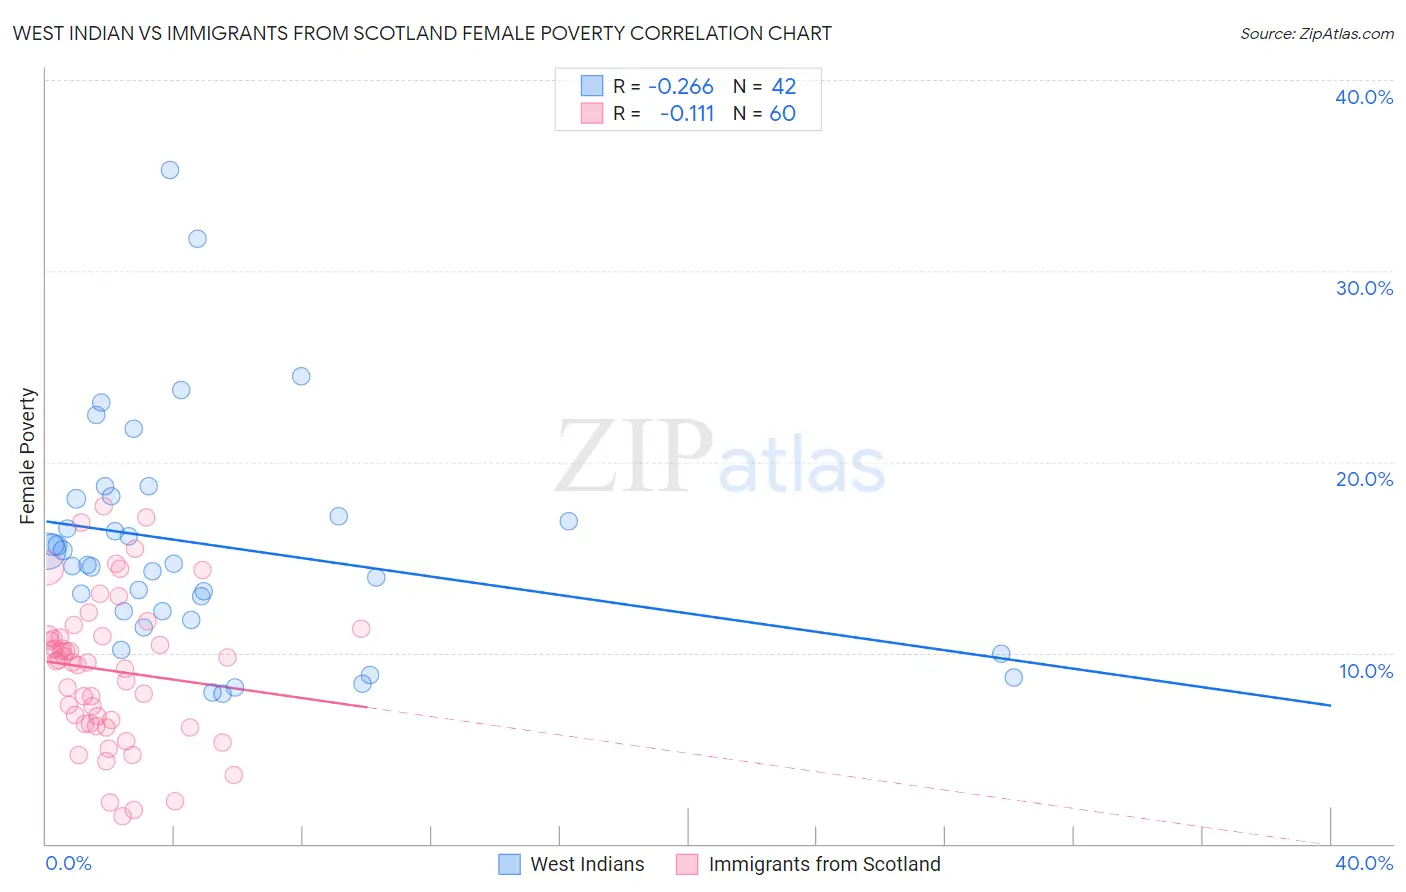
West Indian vs Immigrants from Scotland Female Poverty Correlation Chart
The statistical analysis conducted on geographies consisting of 253,850,168 people shows a weak negative correlation between the proportion of West Indians and poverty level among females in the United States with a correlation coefficient (R) of -0.266 and weighted average of 16.1%. Similarly, the statistical analysis conducted on geographies consisting of 196,374,584 people shows a poor negative correlation between the proportion of Immigrants from Scotland and poverty level among females in the United States with a correlation coefficient (R) of -0.111 and weighted average of 11.5%, a difference of 40.1%.
Female Poverty Correlation Summary
| Measurement | West Indian | Immigrants from Scotland |
| Minimum | 7.8% | 1.4% |
| Maximum | 35.3% | 17.7% |
| Range | 27.4% | 16.2% |
| Mean | 15.7% | 9.1% |
| Median | 14.6% | 9.5% |
| Interquartile 25% (IQ1) | 12.2% | 6.3% |
| Interquartile 75% (IQ3) | 18.1% | 10.9% |
| Interquartile Range (IQR) | 5.9% | 4.6% |
| Standard Deviation (Sample) | 5.9% | 3.8% |
| Standard Deviation (Population) | 5.9% | 3.8% |
Similar Demographics by Female Poverty
Demographics Similar to West Indians by Female Poverty
In terms of female poverty, the demographic groups most similar to West Indians are Vietnamese (16.1%, a difference of 0.020%), Immigrants from Haiti (16.1%, a difference of 0.15%), Immigrants from Cuba (16.1%, a difference of 0.24%), Immigrants from Bahamas (16.1%, a difference of 0.26%), and Spanish American (16.2%, a difference of 0.29%).
| Demographics | Rating | Rank | Female Poverty |
| Barbadians | 0.0 /100 | #274 | Tragic 15.9% |
| Immigrants | Barbados | 0.0 /100 | #275 | Tragic 16.0% |
| Central Americans | 0.0 /100 | #276 | Tragic 16.0% |
| Bangladeshis | 0.0 /100 | #277 | Tragic 16.0% |
| Immigrants | West Indies | 0.0 /100 | #278 | Tragic 16.1% |
| Immigrants | Bahamas | 0.0 /100 | #279 | Tragic 16.1% |
| Vietnamese | 0.0 /100 | #280 | Tragic 16.1% |
| West Indians | 0.0 /100 | #281 | Tragic 16.1% |
| Immigrants | Haiti | 0.0 /100 | #282 | Tragic 16.1% |
| Immigrants | Cuba | 0.0 /100 | #283 | Tragic 16.1% |
| Spanish Americans | 0.0 /100 | #284 | Tragic 16.2% |
| Comanche | 0.0 /100 | #285 | Tragic 16.2% |
| Inupiat | 0.0 /100 | #286 | Tragic 16.2% |
| Immigrants | Belize | 0.0 /100 | #287 | Tragic 16.3% |
| Indonesians | 0.0 /100 | #288 | Tragic 16.4% |
Demographics Similar to Immigrants from Scotland by Female Poverty
In terms of female poverty, the demographic groups most similar to Immigrants from Scotland are Norwegian (11.5%, a difference of 0.040%), Bolivian (11.5%, a difference of 0.050%), Immigrants from Bolivia (11.5%, a difference of 0.12%), Eastern European (11.5%, a difference of 0.27%), and Latvian (11.4%, a difference of 0.59%).
| Demographics | Rating | Rank | Female Poverty |
| Maltese | 99.9 /100 | #11 | Exceptional 11.2% |
| Bhutanese | 99.9 /100 | #12 | Exceptional 11.3% |
| Immigrants | Lithuania | 99.9 /100 | #13 | Exceptional 11.3% |
| Lithuanians | 99.8 /100 | #14 | Exceptional 11.4% |
| Latvians | 99.8 /100 | #15 | Exceptional 11.4% |
| Immigrants | Bolivia | 99.8 /100 | #16 | Exceptional 11.5% |
| Bolivians | 99.8 /100 | #17 | Exceptional 11.5% |
| Immigrants | Scotland | 99.8 /100 | #18 | Exceptional 11.5% |
| Norwegians | 99.8 /100 | #19 | Exceptional 11.5% |
| Eastern Europeans | 99.7 /100 | #20 | Exceptional 11.5% |
| Italians | 99.7 /100 | #21 | Exceptional 11.6% |
| Swedes | 99.7 /100 | #22 | Exceptional 11.6% |
| Burmese | 99.7 /100 | #23 | Exceptional 11.6% |
| Luxembourgers | 99.7 /100 | #24 | Exceptional 11.6% |
| Immigrants | Northern Europe | 99.6 /100 | #25 | Exceptional 11.6% |