Immigrants from South America vs Yuman Female Poverty
COMPARE
Immigrants from South America
Yuman
Female Poverty
Female Poverty Comparison
Immigrants from South America
Yuman
13.7%
FEMALE POVERTY
30.6/ 100
METRIC RATING
195th/ 347
METRIC RANK
20.8%
FEMALE POVERTY
0.0/ 100
METRIC RATING
337th/ 347
METRIC RANK
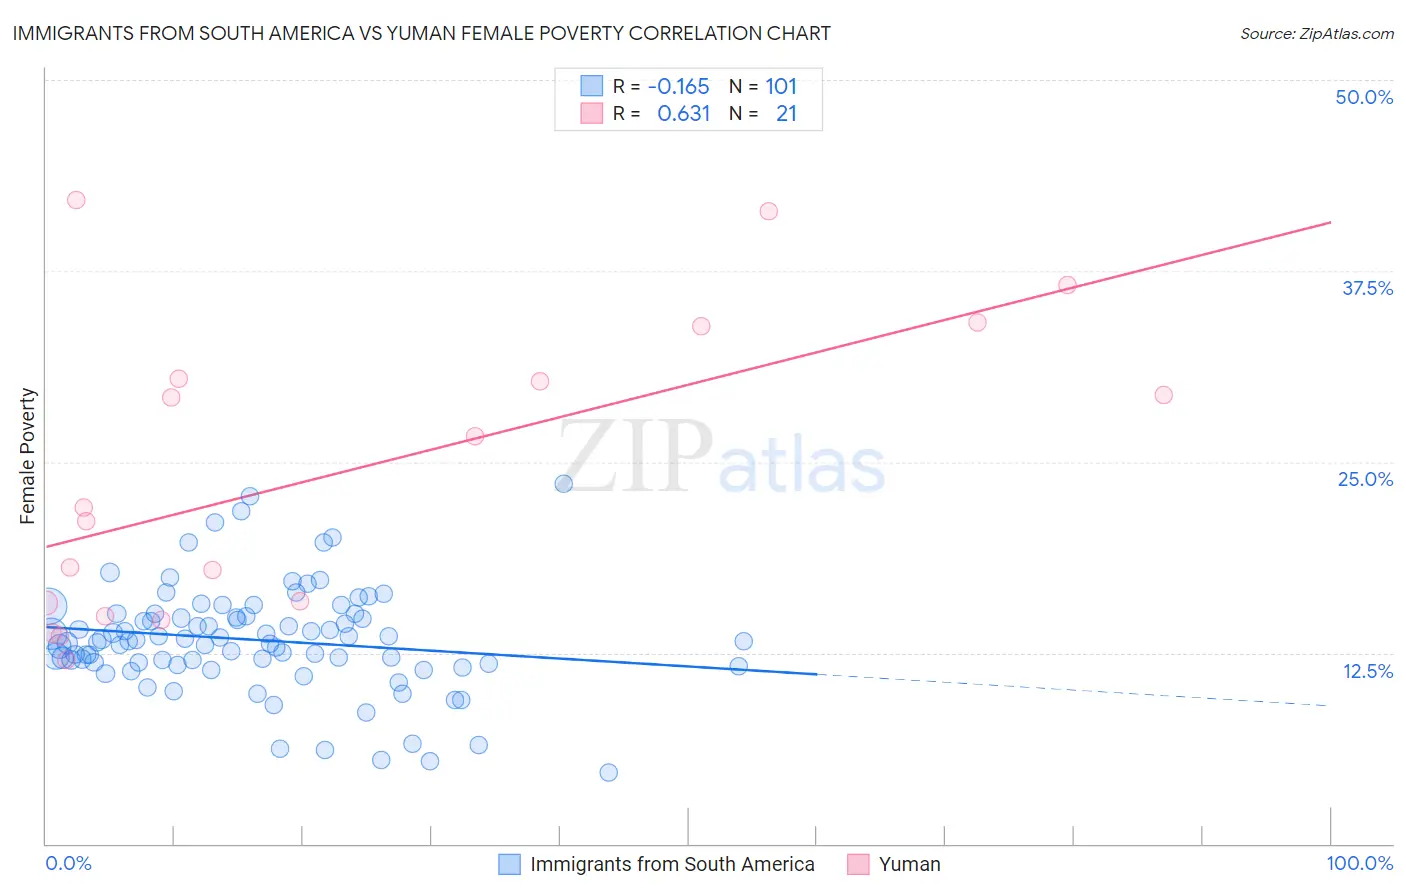
Immigrants from South America vs Yuman Female Poverty Correlation Chart
The statistical analysis conducted on geographies consisting of 485,828,470 people shows a poor negative correlation between the proportion of Immigrants from South America and poverty level among females in the United States with a correlation coefficient (R) of -0.165 and weighted average of 13.7%. Similarly, the statistical analysis conducted on geographies consisting of 40,663,290 people shows a significant positive correlation between the proportion of Yuman and poverty level among females in the United States with a correlation coefficient (R) of 0.631 and weighted average of 20.8%, a difference of 52.1%.
Female Poverty Correlation Summary
| Measurement | Immigrants from South America | Yuman |
| Minimum | 4.6% | 12.1% |
| Maximum | 23.5% | 42.1% |
| Range | 18.9% | 30.1% |
| Mean | 13.3% | 24.5% |
| Median | 13.3% | 22.0% |
| Interquartile 25% (IQ1) | 11.8% | 15.3% |
| Interquartile 75% (IQ3) | 15.0% | 32.2% |
| Interquartile Range (IQR) | 3.2% | 16.8% |
| Standard Deviation (Sample) | 3.5% | 9.7% |
| Standard Deviation (Population) | 3.5% | 9.5% |
Similar Demographics by Female Poverty
Demographics Similar to Immigrants from South America by Female Poverty
In terms of female poverty, the demographic groups most similar to Immigrants from South America are Delaware (13.7%, a difference of 0.060%), Iraqi (13.7%, a difference of 0.12%), Immigrants from Costa Rica (13.7%, a difference of 0.14%), South American Indian (13.7%, a difference of 0.19%), and Immigrants from Kuwait (13.7%, a difference of 0.23%).
| Demographics | Rating | Rank | Female Poverty |
| Hawaiians | 39.9 /100 | #188 | Fair 13.6% |
| Uruguayans | 39.8 /100 | #189 | Fair 13.6% |
| Sierra Leoneans | 33.1 /100 | #190 | Fair 13.7% |
| Immigrants | Kuwait | 32.7 /100 | #191 | Fair 13.7% |
| Immigrants | Costa Rica | 31.9 /100 | #192 | Fair 13.7% |
| Iraqis | 31.8 /100 | #193 | Fair 13.7% |
| Delaware | 31.1 /100 | #194 | Fair 13.7% |
| Immigrants | South America | 30.6 /100 | #195 | Fair 13.7% |
| South American Indians | 28.9 /100 | #196 | Fair 13.7% |
| Arabs | 28.6 /100 | #197 | Fair 13.7% |
| Immigrants | Uganda | 28.5 /100 | #198 | Fair 13.7% |
| Immigrants | Lebanon | 25.6 /100 | #199 | Fair 13.8% |
| Spanish | 21.4 /100 | #200 | Fair 13.9% |
| Immigrants | Kenya | 21.1 /100 | #201 | Fair 13.9% |
| Hmong | 21.1 /100 | #202 | Fair 13.9% |
Demographics Similar to Yuman by Female Poverty
In terms of female poverty, the demographic groups most similar to Yuman are Sioux (20.9%, a difference of 0.19%), Hopi (21.0%, a difference of 0.56%), Pueblo (20.7%, a difference of 0.81%), Yup'ik (21.5%, a difference of 3.1%), and Cheyenne (20.2%, a difference of 3.2%).
| Demographics | Rating | Rank | Female Poverty |
| Dominicans | 0.0 /100 | #330 | Tragic 19.1% |
| Natives/Alaskans | 0.0 /100 | #331 | Tragic 19.2% |
| Apache | 0.0 /100 | #332 | Tragic 19.2% |
| Immigrants | Dominican Republic | 0.0 /100 | #333 | Tragic 19.3% |
| Houma | 0.0 /100 | #334 | Tragic 20.0% |
| Cheyenne | 0.0 /100 | #335 | Tragic 20.2% |
| Pueblo | 0.0 /100 | #336 | Tragic 20.7% |
| Yuman | 0.0 /100 | #337 | Tragic 20.8% |
| Sioux | 0.0 /100 | #338 | Tragic 20.9% |
| Hopi | 0.0 /100 | #339 | Tragic 21.0% |
| Yup'ik | 0.0 /100 | #340 | Tragic 21.5% |
| Crow | 0.0 /100 | #341 | Tragic 22.1% |
| Immigrants | Yemen | 0.0 /100 | #342 | Tragic 22.8% |
| Lumbee | 0.0 /100 | #343 | Tragic 23.5% |
| Pima | 0.0 /100 | #344 | Tragic 23.6% |