West Indian vs French Female Poverty
COMPARE
West Indian
French
Female Poverty
Female Poverty Comparison
West Indians
French
16.1%
FEMALE POVERTY
0.0/ 100
METRIC RATING
281st/ 347
METRIC RANK
12.9%
FEMALE POVERTY
85.6/ 100
METRIC RATING
135th/ 347
METRIC RANK
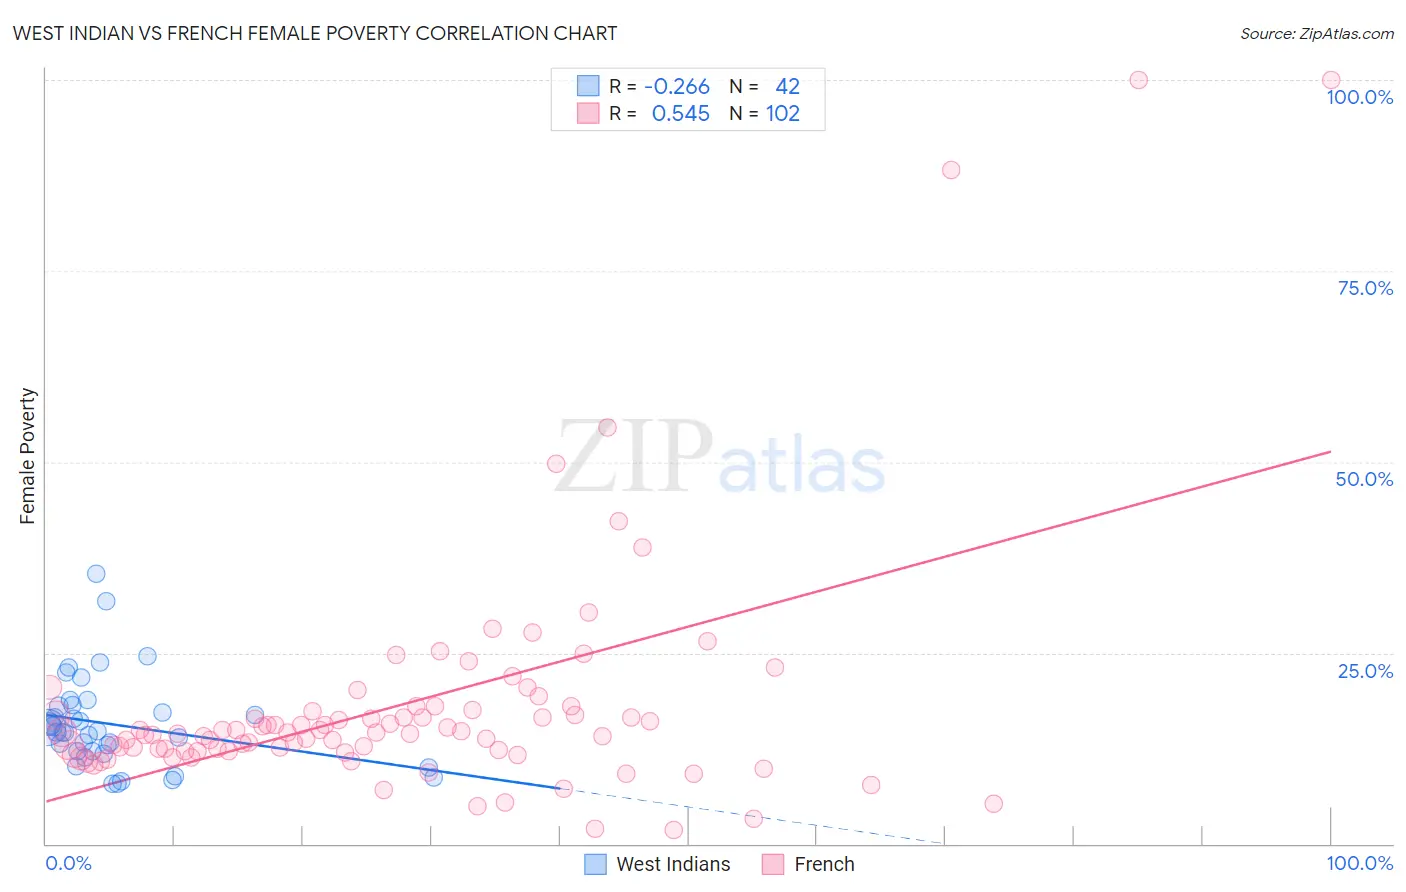
West Indian vs French Female Poverty Correlation Chart
The statistical analysis conducted on geographies consisting of 253,850,168 people shows a weak negative correlation between the proportion of West Indians and poverty level among females in the United States with a correlation coefficient (R) of -0.266 and weighted average of 16.1%. Similarly, the statistical analysis conducted on geographies consisting of 571,140,753 people shows a substantial positive correlation between the proportion of French and poverty level among females in the United States with a correlation coefficient (R) of 0.545 and weighted average of 12.9%, a difference of 25.2%.
Female Poverty Correlation Summary
| Measurement | West Indian | French |
| Minimum | 7.8% | 1.8% |
| Maximum | 35.3% | 100.0% |
| Range | 27.4% | 98.2% |
| Mean | 15.7% | 18.1% |
| Median | 14.6% | 14.5% |
| Interquartile 25% (IQ1) | 12.2% | 12.1% |
| Interquartile 75% (IQ3) | 18.1% | 17.4% |
| Interquartile Range (IQR) | 5.9% | 5.3% |
| Standard Deviation (Sample) | 5.9% | 15.9% |
| Standard Deviation (Population) | 5.9% | 15.8% |
Similar Demographics by Female Poverty
Demographics Similar to West Indians by Female Poverty
In terms of female poverty, the demographic groups most similar to West Indians are Vietnamese (16.1%, a difference of 0.020%), Immigrants from Haiti (16.1%, a difference of 0.15%), Immigrants from Cuba (16.1%, a difference of 0.24%), Immigrants from Bahamas (16.1%, a difference of 0.26%), and Spanish American (16.2%, a difference of 0.29%).
| Demographics | Rating | Rank | Female Poverty |
| Barbadians | 0.0 /100 | #274 | Tragic 15.9% |
| Immigrants | Barbados | 0.0 /100 | #275 | Tragic 16.0% |
| Central Americans | 0.0 /100 | #276 | Tragic 16.0% |
| Bangladeshis | 0.0 /100 | #277 | Tragic 16.0% |
| Immigrants | West Indies | 0.0 /100 | #278 | Tragic 16.1% |
| Immigrants | Bahamas | 0.0 /100 | #279 | Tragic 16.1% |
| Vietnamese | 0.0 /100 | #280 | Tragic 16.1% |
| West Indians | 0.0 /100 | #281 | Tragic 16.1% |
| Immigrants | Haiti | 0.0 /100 | #282 | Tragic 16.1% |
| Immigrants | Cuba | 0.0 /100 | #283 | Tragic 16.1% |
| Spanish Americans | 0.0 /100 | #284 | Tragic 16.2% |
| Comanche | 0.0 /100 | #285 | Tragic 16.2% |
| Inupiat | 0.0 /100 | #286 | Tragic 16.2% |
| Immigrants | Belize | 0.0 /100 | #287 | Tragic 16.3% |
| Indonesians | 0.0 /100 | #288 | Tragic 16.4% |
Demographics Similar to French by Female Poverty
In terms of female poverty, the demographic groups most similar to French are Immigrants from Switzerland (12.9%, a difference of 0.050%), Peruvian (12.9%, a difference of 0.080%), Chilean (12.9%, a difference of 0.17%), Immigrants from Western Europe (12.8%, a difference of 0.22%), and Immigrants from Jordan (12.8%, a difference of 0.28%).
| Demographics | Rating | Rank | Female Poverty |
| Immigrants | Belarus | 88.2 /100 | #128 | Excellent 12.8% |
| Immigrants | Brazil | 87.9 /100 | #129 | Excellent 12.8% |
| Immigrants | Vietnam | 87.1 /100 | #130 | Excellent 12.8% |
| Immigrants | Argentina | 87.0 /100 | #131 | Excellent 12.8% |
| Immigrants | Jordan | 86.9 /100 | #132 | Excellent 12.8% |
| Immigrants | Western Europe | 86.6 /100 | #133 | Excellent 12.8% |
| Immigrants | Switzerland | 85.8 /100 | #134 | Excellent 12.9% |
| French | 85.6 /100 | #135 | Excellent 12.9% |
| Peruvians | 85.2 /100 | #136 | Excellent 12.9% |
| Chileans | 84.7 /100 | #137 | Excellent 12.9% |
| Immigrants | France | 83.6 /100 | #138 | Excellent 12.9% |
| Basques | 83.1 /100 | #139 | Excellent 12.9% |
| Pakistanis | 83.0 /100 | #140 | Excellent 12.9% |
| Icelanders | 81.1 /100 | #141 | Excellent 13.0% |
| Brazilians | 80.5 /100 | #142 | Excellent 13.0% |