Immigrants from Japan vs Yuman Female Poverty
COMPARE
Immigrants from Japan
Yuman
Female Poverty
Female Poverty Comparison
Immigrants from Japan
Yuman
11.9%
FEMALE POVERTY
99.0/ 100
METRIC RATING
48th/ 347
METRIC RANK
20.8%
FEMALE POVERTY
0.0/ 100
METRIC RATING
337th/ 347
METRIC RANK
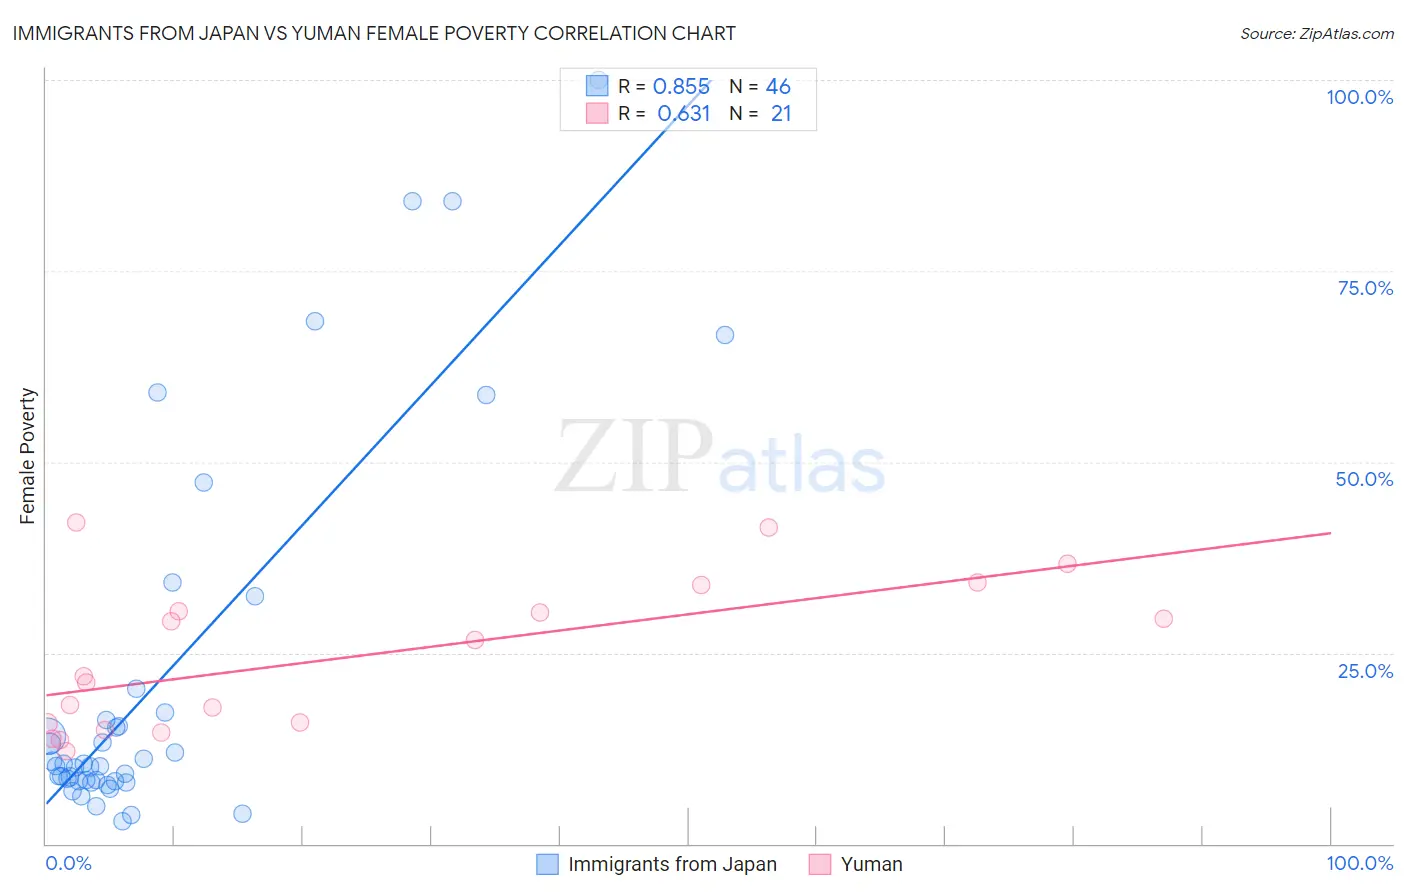
Immigrants from Japan vs Yuman Female Poverty Correlation Chart
The statistical analysis conducted on geographies consisting of 339,963,649 people shows a very strong positive correlation between the proportion of Immigrants from Japan and poverty level among females in the United States with a correlation coefficient (R) of 0.855 and weighted average of 11.9%. Similarly, the statistical analysis conducted on geographies consisting of 40,663,290 people shows a significant positive correlation between the proportion of Yuman and poverty level among females in the United States with a correlation coefficient (R) of 0.631 and weighted average of 20.8%, a difference of 74.4%.
Female Poverty Correlation Summary
| Measurement | Immigrants from Japan | Yuman |
| Minimum | 2.9% | 12.1% |
| Maximum | 100.0% | 42.1% |
| Range | 97.1% | 30.1% |
| Mean | 21.6% | 24.5% |
| Median | 10.3% | 22.0% |
| Interquartile 25% (IQ1) | 8.2% | 15.3% |
| Interquartile 75% (IQ3) | 17.1% | 32.2% |
| Interquartile Range (IQR) | 9.0% | 16.8% |
| Standard Deviation (Sample) | 24.6% | 9.7% |
| Standard Deviation (Population) | 24.4% | 9.5% |
Similar Demographics by Female Poverty
Demographics Similar to Immigrants from Japan by Female Poverty
In terms of female poverty, the demographic groups most similar to Immigrants from Japan are Immigrants from Romania (12.0%, a difference of 0.19%), Slovene (12.0%, a difference of 0.20%), Asian (11.9%, a difference of 0.23%), Immigrants from Bulgaria (12.0%, a difference of 0.42%), and Turkish (11.9%, a difference of 0.44%).
| Demographics | Rating | Rank | Female Poverty |
| Czechs | 99.2 /100 | #41 | Exceptional 11.9% |
| Immigrants | Moldova | 99.2 /100 | #42 | Exceptional 11.9% |
| Koreans | 99.2 /100 | #43 | Exceptional 11.9% |
| Tongans | 99.2 /100 | #44 | Exceptional 11.9% |
| Immigrants | Czechoslovakia | 99.2 /100 | #45 | Exceptional 11.9% |
| Turks | 99.2 /100 | #46 | Exceptional 11.9% |
| Asians | 99.1 /100 | #47 | Exceptional 11.9% |
| Immigrants | Japan | 99.0 /100 | #48 | Exceptional 11.9% |
| Immigrants | Romania | 99.0 /100 | #49 | Exceptional 12.0% |
| Slovenes | 98.9 /100 | #50 | Exceptional 12.0% |
| Immigrants | Bulgaria | 98.9 /100 | #51 | Exceptional 12.0% |
| Immigrants | Croatia | 98.7 /100 | #52 | Exceptional 12.0% |
| Immigrants | Austria | 98.7 /100 | #53 | Exceptional 12.0% |
| Immigrants | Philippines | 98.7 /100 | #54 | Exceptional 12.1% |
| Immigrants | Sri Lanka | 98.5 /100 | #55 | Exceptional 12.1% |
Demographics Similar to Yuman by Female Poverty
In terms of female poverty, the demographic groups most similar to Yuman are Sioux (20.9%, a difference of 0.19%), Hopi (21.0%, a difference of 0.56%), Pueblo (20.7%, a difference of 0.81%), Yup'ik (21.5%, a difference of 3.1%), and Cheyenne (20.2%, a difference of 3.2%).
| Demographics | Rating | Rank | Female Poverty |
| Dominicans | 0.0 /100 | #330 | Tragic 19.1% |
| Natives/Alaskans | 0.0 /100 | #331 | Tragic 19.2% |
| Apache | 0.0 /100 | #332 | Tragic 19.2% |
| Immigrants | Dominican Republic | 0.0 /100 | #333 | Tragic 19.3% |
| Houma | 0.0 /100 | #334 | Tragic 20.0% |
| Cheyenne | 0.0 /100 | #335 | Tragic 20.2% |
| Pueblo | 0.0 /100 | #336 | Tragic 20.7% |
| Yuman | 0.0 /100 | #337 | Tragic 20.8% |
| Sioux | 0.0 /100 | #338 | Tragic 20.9% |
| Hopi | 0.0 /100 | #339 | Tragic 21.0% |
| Yup'ik | 0.0 /100 | #340 | Tragic 21.5% |
| Crow | 0.0 /100 | #341 | Tragic 22.1% |
| Immigrants | Yemen | 0.0 /100 | #342 | Tragic 22.8% |
| Lumbee | 0.0 /100 | #343 | Tragic 23.5% |
| Pima | 0.0 /100 | #344 | Tragic 23.6% |