West Indian vs Czechoslovakian Single Female Poverty
COMPARE
West Indian
Czechoslovakian
Single Female Poverty
Single Female Poverty Comparison
West Indians
Czechoslovakians
22.3%
SINGLE FEMALE POVERTY
1.9/ 100
METRIC RATING
243rd/ 347
METRIC RANK
21.3%
SINGLE FEMALE POVERTY
27.7/ 100
METRIC RATING
194th/ 347
METRIC RANK
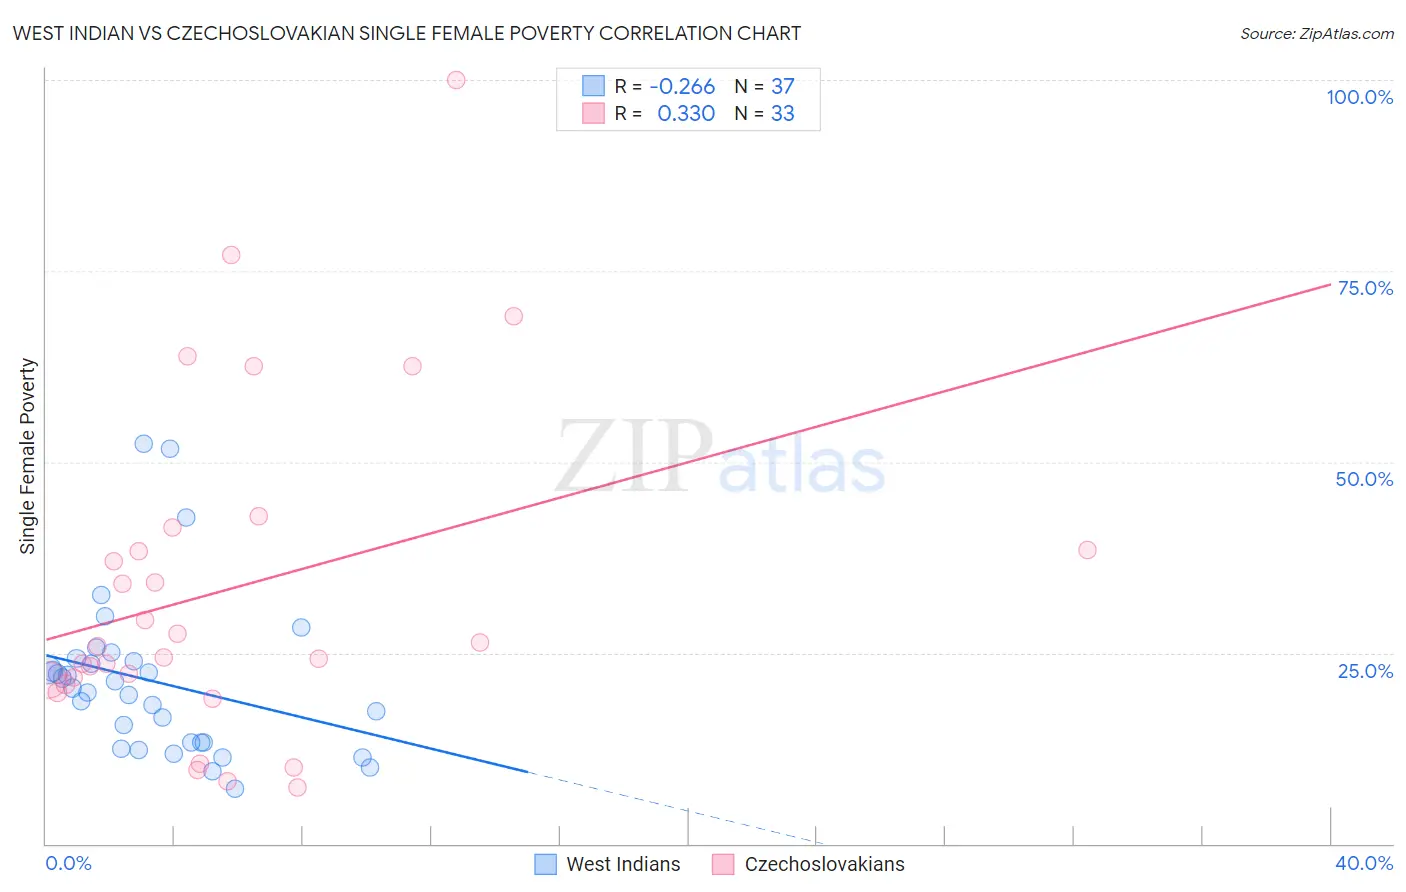
West Indian vs Czechoslovakian Single Female Poverty Correlation Chart
The statistical analysis conducted on geographies consisting of 252,099,029 people shows a weak negative correlation between the proportion of West Indians and poverty level among single females in the United States with a correlation coefficient (R) of -0.266 and weighted average of 22.3%. Similarly, the statistical analysis conducted on geographies consisting of 361,916,280 people shows a mild positive correlation between the proportion of Czechoslovakians and poverty level among single females in the United States with a correlation coefficient (R) of 0.330 and weighted average of 21.3%, a difference of 4.6%.
Single Female Poverty Correlation Summary
| Measurement | West Indian | Czechoslovakian |
| Minimum | 7.2% | 7.4% |
| Maximum | 52.4% | 100.0% |
| Range | 45.1% | 92.6% |
| Mean | 21.3% | 33.3% |
| Median | 20.4% | 25.9% |
| Interquartile 25% (IQ1) | 13.2% | 21.1% |
| Interquartile 75% (IQ3) | 24.1% | 39.9% |
| Interquartile Range (IQR) | 10.9% | 18.8% |
| Standard Deviation (Sample) | 10.4% | 21.6% |
| Standard Deviation (Population) | 10.2% | 21.3% |
Similar Demographics by Single Female Poverty
Demographics Similar to West Indians by Single Female Poverty
In terms of single female poverty, the demographic groups most similar to West Indians are Immigrants from Middle Africa (22.3%, a difference of 0.010%), Immigrants from Bangladesh (22.3%, a difference of 0.050%), Bermudan (22.3%, a difference of 0.090%), Cape Verdean (22.3%, a difference of 0.16%), and French (22.2%, a difference of 0.30%).
| Demographics | Rating | Rank | Single Female Poverty |
| Immigrants | Ecuador | 4.2 /100 | #236 | Tragic 22.0% |
| Vietnamese | 4.0 /100 | #237 | Tragic 22.0% |
| French Canadians | 2.8 /100 | #238 | Tragic 22.2% |
| Malaysians | 2.8 /100 | #239 | Tragic 22.2% |
| French | 2.3 /100 | #240 | Tragic 22.2% |
| Cape Verdeans | 2.1 /100 | #241 | Tragic 22.3% |
| Bermudans | 2.0 /100 | #242 | Tragic 22.3% |
| West Indians | 1.9 /100 | #243 | Tragic 22.3% |
| Immigrants | Middle Africa | 1.9 /100 | #244 | Tragic 22.3% |
| Immigrants | Bangladesh | 1.8 /100 | #245 | Tragic 22.3% |
| Liberians | 1.4 /100 | #246 | Tragic 22.4% |
| Immigrants | El Salvador | 1.4 /100 | #247 | Tragic 22.4% |
| Belizeans | 1.4 /100 | #248 | Tragic 22.4% |
| Immigrants | Caribbean | 1.3 /100 | #249 | Tragic 22.4% |
| Immigrants | Bahamas | 1.2 /100 | #250 | Tragic 22.5% |
Demographics Similar to Czechoslovakians by Single Female Poverty
In terms of single female poverty, the demographic groups most similar to Czechoslovakians are Nicaraguan (21.3%, a difference of 0.010%), Basque (21.3%, a difference of 0.030%), Immigrants from Saudi Arabia (21.3%, a difference of 0.050%), Japanese (21.3%, a difference of 0.10%), and Immigrants from Jamaica (21.3%, a difference of 0.21%).
| Demographics | Rating | Rank | Single Female Poverty |
| Immigrants | Nigeria | 36.8 /100 | #187 | Fair 21.2% |
| Yugoslavians | 35.4 /100 | #188 | Fair 21.2% |
| Immigrants | Cuba | 35.3 /100 | #189 | Fair 21.2% |
| Trinidadians and Tobagonians | 35.2 /100 | #190 | Fair 21.2% |
| Immigrants | Germany | 31.1 /100 | #191 | Fair 21.3% |
| Immigrants | Jamaica | 30.5 /100 | #192 | Fair 21.3% |
| Basques | 28.1 /100 | #193 | Fair 21.3% |
| Czechoslovakians | 27.7 /100 | #194 | Fair 21.3% |
| Nicaraguans | 27.6 /100 | #195 | Fair 21.3% |
| Immigrants | Saudi Arabia | 27.1 /100 | #196 | Fair 21.3% |
| Japanese | 26.4 /100 | #197 | Fair 21.3% |
| Swiss | 24.2 /100 | #198 | Fair 21.4% |
| Immigrants | Immigrants | 22.0 /100 | #199 | Fair 21.4% |
| Irish | 21.4 /100 | #200 | Fair 21.4% |
| Nigerians | 20.9 /100 | #201 | Fair 21.4% |