Immigrants from Ethiopia vs Native Hawaiian Family Poverty
COMPARE
Immigrants from Ethiopia
Native Hawaiian
Family Poverty
Family Poverty Comparison
Immigrants from Ethiopia
Native Hawaiians
8.9%
FAMILY POVERTY
62.5/ 100
METRIC RATING
167th/ 347
METRIC RANK
8.3%
FAMILY POVERTY
91.3/ 100
METRIC RATING
121st/ 347
METRIC RANK
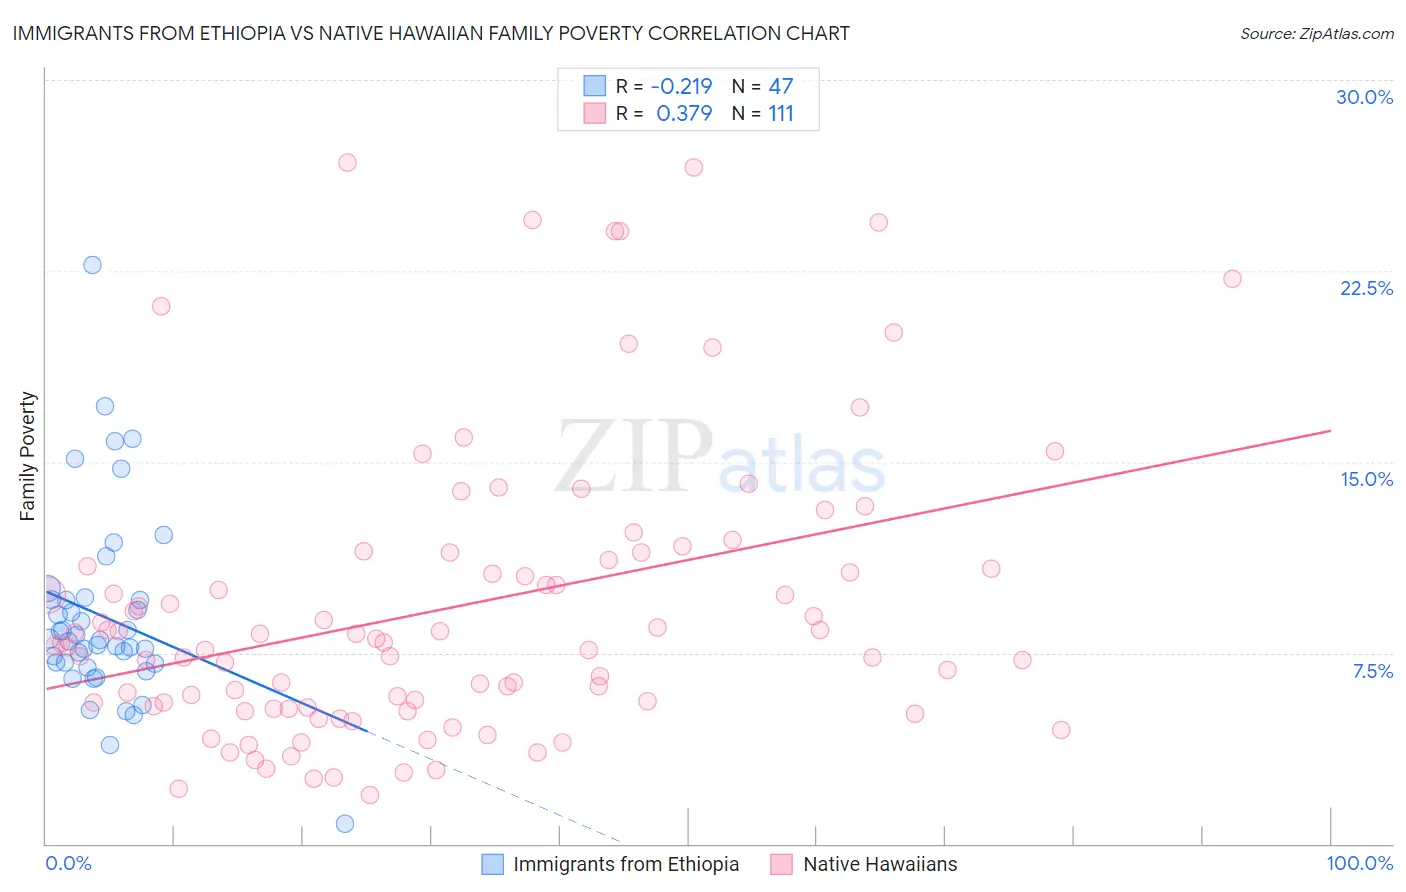
Immigrants from Ethiopia vs Native Hawaiian Family Poverty Correlation Chart
The statistical analysis conducted on geographies consisting of 211,298,755 people shows a weak negative correlation between the proportion of Immigrants from Ethiopia and poverty level among families in the United States with a correlation coefficient (R) of -0.219 and weighted average of 8.9%. Similarly, the statistical analysis conducted on geographies consisting of 331,480,181 people shows a mild positive correlation between the proportion of Native Hawaiians and poverty level among families in the United States with a correlation coefficient (R) of 0.379 and weighted average of 8.3%, a difference of 6.5%.
Family Poverty Correlation Summary
| Measurement | Immigrants from Ethiopia | Native Hawaiian |
| Minimum | 0.78% | 1.9% |
| Maximum | 22.7% | 26.8% |
| Range | 22.0% | 24.8% |
| Mean | 8.9% | 9.3% |
| Median | 8.0% | 7.9% |
| Interquartile 25% (IQ1) | 7.1% | 5.3% |
| Interquartile 75% (IQ3) | 9.6% | 11.1% |
| Interquartile Range (IQR) | 2.5% | 5.8% |
| Standard Deviation (Sample) | 3.8% | 5.7% |
| Standard Deviation (Population) | 3.7% | 5.6% |
Similar Demographics by Family Poverty
Demographics Similar to Immigrants from Ethiopia by Family Poverty
In terms of family poverty, the demographic groups most similar to Immigrants from Ethiopia are Israeli (8.9%, a difference of 0.060%), Afghan (8.8%, a difference of 0.14%), Guamanian/Chamorro (8.8%, a difference of 0.32%), Celtic (8.8%, a difference of 0.35%), and Immigrants from Chile (8.9%, a difference of 0.41%).
| Demographics | Rating | Rank | Family Poverty |
| Hungarians | 67.2 /100 | #160 | Good 8.8% |
| Immigrants | Northern Africa | 66.9 /100 | #161 | Good 8.8% |
| Ethiopians | 66.3 /100 | #162 | Good 8.8% |
| Pennsylvania Germans | 66.0 /100 | #163 | Good 8.8% |
| Celtics | 64.9 /100 | #164 | Good 8.8% |
| Guamanians/Chamorros | 64.7 /100 | #165 | Good 8.8% |
| Afghans | 63.5 /100 | #166 | Good 8.8% |
| Immigrants | Ethiopia | 62.5 /100 | #167 | Good 8.9% |
| Israelis | 62.1 /100 | #168 | Good 8.9% |
| Immigrants | Chile | 59.6 /100 | #169 | Average 8.9% |
| Kenyans | 58.2 /100 | #170 | Average 8.9% |
| Lebanese | 57.6 /100 | #171 | Average 8.9% |
| Immigrants | Peru | 57.5 /100 | #172 | Average 8.9% |
| Immigrants | Fiji | 56.4 /100 | #173 | Average 8.9% |
| Immigrants | Albania | 50.0 /100 | #174 | Average 9.0% |
Demographics Similar to Native Hawaiians by Family Poverty
In terms of family poverty, the demographic groups most similar to Native Hawaiians are Paraguayan (8.3%, a difference of 0.010%), Palestinian (8.3%, a difference of 0.080%), Immigrants from Egypt (8.3%, a difference of 0.17%), Soviet Union (8.3%, a difference of 0.18%), and Pakistani (8.3%, a difference of 0.22%).
| Demographics | Rating | Rank | Family Poverty |
| Immigrants | Zimbabwe | 94.0 /100 | #114 | Exceptional 8.2% |
| Immigrants | Israel | 93.5 /100 | #115 | Exceptional 8.2% |
| South Africans | 93.4 /100 | #116 | Exceptional 8.2% |
| Immigrants | Russia | 93.2 /100 | #117 | Exceptional 8.2% |
| Immigrants | Western Europe | 92.9 /100 | #118 | Exceptional 8.2% |
| French | 92.8 /100 | #119 | Exceptional 8.3% |
| Immigrants | Egypt | 91.6 /100 | #120 | Exceptional 8.3% |
| Native Hawaiians | 91.3 /100 | #121 | Exceptional 8.3% |
| Paraguayans | 91.2 /100 | #122 | Exceptional 8.3% |
| Palestinians | 91.1 /100 | #123 | Exceptional 8.3% |
| Soviet Union | 90.8 /100 | #124 | Exceptional 8.3% |
| Pakistanis | 90.8 /100 | #125 | Exceptional 8.3% |
| Icelanders | 90.3 /100 | #126 | Exceptional 8.3% |
| Immigrants | Hungary | 89.9 /100 | #127 | Excellent 8.4% |
| Argentineans | 89.6 /100 | #128 | Excellent 8.4% |