Barbadian vs Native Hawaiian Family Poverty
COMPARE
Barbadian
Native Hawaiian
Family Poverty
Family Poverty Comparison
Barbadians
Native Hawaiians
11.3%
FAMILY POVERTY
0.0/ 100
METRIC RATING
285th/ 347
METRIC RANK
8.3%
FAMILY POVERTY
91.3/ 100
METRIC RATING
121st/ 347
METRIC RANK
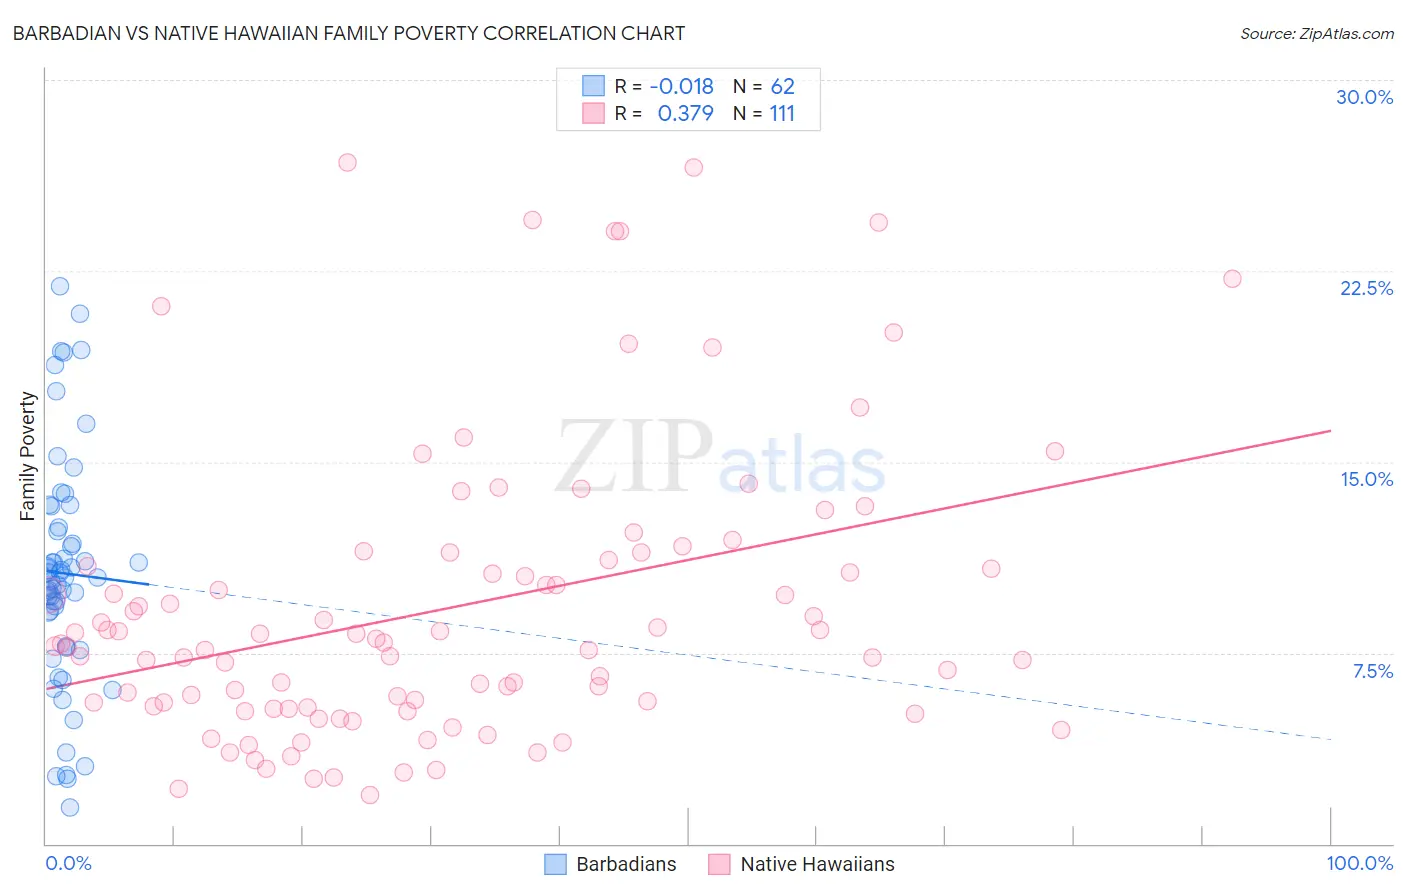
Barbadian vs Native Hawaiian Family Poverty Correlation Chart
The statistical analysis conducted on geographies consisting of 141,196,008 people shows no correlation between the proportion of Barbadians and poverty level among families in the United States with a correlation coefficient (R) of -0.018 and weighted average of 11.3%. Similarly, the statistical analysis conducted on geographies consisting of 331,480,181 people shows a mild positive correlation between the proportion of Native Hawaiians and poverty level among families in the United States with a correlation coefficient (R) of 0.379 and weighted average of 8.3%, a difference of 36.5%.
Family Poverty Correlation Summary
| Measurement | Barbadian | Native Hawaiian |
| Minimum | 1.4% | 1.9% |
| Maximum | 21.9% | 26.8% |
| Range | 20.5% | 24.8% |
| Mean | 10.6% | 9.3% |
| Median | 10.5% | 7.9% |
| Interquartile 25% (IQ1) | 7.7% | 5.3% |
| Interquartile 75% (IQ3) | 12.4% | 11.1% |
| Interquartile Range (IQR) | 4.7% | 5.8% |
| Standard Deviation (Sample) | 4.6% | 5.7% |
| Standard Deviation (Population) | 4.5% | 5.6% |
Similar Demographics by Family Poverty
Demographics Similar to Barbadians by Family Poverty
In terms of family poverty, the demographic groups most similar to Barbadians are Yaqui (11.3%, a difference of 0.080%), Indonesian (11.3%, a difference of 0.20%), Immigrants from Cuba (11.3%, a difference of 0.24%), Immigrants from West Indies (11.3%, a difference of 0.50%), and Belizean (11.3%, a difference of 0.77%).
| Demographics | Rating | Rank | Family Poverty |
| Guyanese | 0.1 /100 | #278 | Tragic 11.2% |
| Blackfeet | 0.0 /100 | #279 | Tragic 11.3% |
| Belizeans | 0.0 /100 | #280 | Tragic 11.3% |
| Immigrants | West Indies | 0.0 /100 | #281 | Tragic 11.3% |
| Immigrants | Cuba | 0.0 /100 | #282 | Tragic 11.3% |
| Indonesians | 0.0 /100 | #283 | Tragic 11.3% |
| Yaqui | 0.0 /100 | #284 | Tragic 11.3% |
| Barbadians | 0.0 /100 | #285 | Tragic 11.3% |
| Senegalese | 0.0 /100 | #286 | Tragic 11.5% |
| Vietnamese | 0.0 /100 | #287 | Tragic 11.5% |
| Immigrants | Belize | 0.0 /100 | #288 | Tragic 11.5% |
| Immigrants | Barbados | 0.0 /100 | #289 | Tragic 11.5% |
| West Indians | 0.0 /100 | #290 | Tragic 11.5% |
| Haitians | 0.0 /100 | #291 | Tragic 11.5% |
| Immigrants | Somalia | 0.0 /100 | #292 | Tragic 11.5% |
Demographics Similar to Native Hawaiians by Family Poverty
In terms of family poverty, the demographic groups most similar to Native Hawaiians are Paraguayan (8.3%, a difference of 0.010%), Palestinian (8.3%, a difference of 0.080%), Immigrants from Egypt (8.3%, a difference of 0.17%), Soviet Union (8.3%, a difference of 0.18%), and Pakistani (8.3%, a difference of 0.22%).
| Demographics | Rating | Rank | Family Poverty |
| Immigrants | Zimbabwe | 94.0 /100 | #114 | Exceptional 8.2% |
| Immigrants | Israel | 93.5 /100 | #115 | Exceptional 8.2% |
| South Africans | 93.4 /100 | #116 | Exceptional 8.2% |
| Immigrants | Russia | 93.2 /100 | #117 | Exceptional 8.2% |
| Immigrants | Western Europe | 92.9 /100 | #118 | Exceptional 8.2% |
| French | 92.8 /100 | #119 | Exceptional 8.3% |
| Immigrants | Egypt | 91.6 /100 | #120 | Exceptional 8.3% |
| Native Hawaiians | 91.3 /100 | #121 | Exceptional 8.3% |
| Paraguayans | 91.2 /100 | #122 | Exceptional 8.3% |
| Palestinians | 91.1 /100 | #123 | Exceptional 8.3% |
| Soviet Union | 90.8 /100 | #124 | Exceptional 8.3% |
| Pakistanis | 90.8 /100 | #125 | Exceptional 8.3% |
| Icelanders | 90.3 /100 | #126 | Exceptional 8.3% |
| Immigrants | Hungary | 89.9 /100 | #127 | Excellent 8.4% |
| Argentineans | 89.6 /100 | #128 | Excellent 8.4% |