Guyanese vs Native Hawaiian Family Poverty
COMPARE
Guyanese
Native Hawaiian
Family Poverty
Family Poverty Comparison
Guyanese
Native Hawaiians
11.2%
FAMILY POVERTY
0.1/ 100
METRIC RATING
278th/ 347
METRIC RANK
8.3%
FAMILY POVERTY
91.3/ 100
METRIC RATING
121st/ 347
METRIC RANK
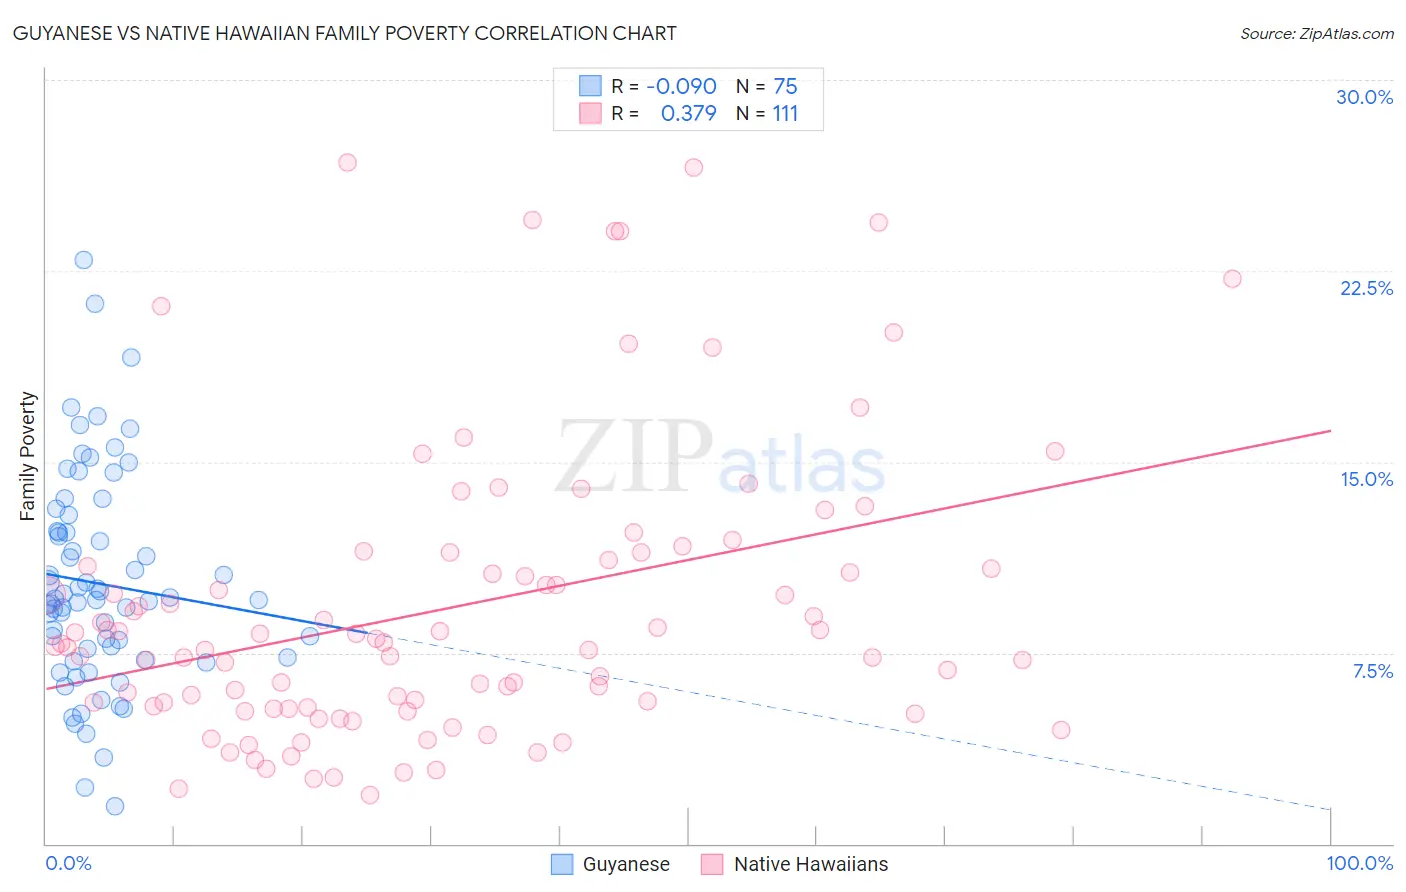
Guyanese vs Native Hawaiian Family Poverty Correlation Chart
The statistical analysis conducted on geographies consisting of 176,578,475 people shows a slight negative correlation between the proportion of Guyanese and poverty level among families in the United States with a correlation coefficient (R) of -0.090 and weighted average of 11.2%. Similarly, the statistical analysis conducted on geographies consisting of 331,480,181 people shows a mild positive correlation between the proportion of Native Hawaiians and poverty level among families in the United States with a correlation coefficient (R) of 0.379 and weighted average of 8.3%, a difference of 35.2%.
Family Poverty Correlation Summary
| Measurement | Guyanese | Native Hawaiian |
| Minimum | 1.5% | 1.9% |
| Maximum | 22.9% | 26.8% |
| Range | 21.5% | 24.8% |
| Mean | 10.2% | 9.3% |
| Median | 9.6% | 7.9% |
| Interquartile 25% (IQ1) | 7.3% | 5.3% |
| Interquartile 75% (IQ3) | 12.3% | 11.1% |
| Interquartile Range (IQR) | 4.9% | 5.8% |
| Standard Deviation (Sample) | 4.2% | 5.7% |
| Standard Deviation (Population) | 4.1% | 5.6% |
Similar Demographics by Family Poverty
Demographics Similar to Guyanese by Family Poverty
In terms of family poverty, the demographic groups most similar to Guyanese are Chippewa (11.2%, a difference of 0.030%), Immigrants from Guyana (11.2%, a difference of 0.12%), Central American (11.2%, a difference of 0.14%), Blackfeet (11.3%, a difference of 0.14%), and Belizean (11.3%, a difference of 0.18%).
| Demographics | Rating | Rank | Family Poverty |
| Immigrants | Bahamas | 0.1 /100 | #271 | Tragic 11.1% |
| Immigrants | Jamaica | 0.1 /100 | #272 | Tragic 11.2% |
| Somalis | 0.1 /100 | #273 | Tragic 11.2% |
| Spanish Americans | 0.1 /100 | #274 | Tragic 11.2% |
| Central Americans | 0.1 /100 | #275 | Tragic 11.2% |
| Immigrants | Guyana | 0.1 /100 | #276 | Tragic 11.2% |
| Chippewa | 0.1 /100 | #277 | Tragic 11.2% |
| Guyanese | 0.1 /100 | #278 | Tragic 11.2% |
| Blackfeet | 0.0 /100 | #279 | Tragic 11.3% |
| Belizeans | 0.0 /100 | #280 | Tragic 11.3% |
| Immigrants | West Indies | 0.0 /100 | #281 | Tragic 11.3% |
| Immigrants | Cuba | 0.0 /100 | #282 | Tragic 11.3% |
| Indonesians | 0.0 /100 | #283 | Tragic 11.3% |
| Yaqui | 0.0 /100 | #284 | Tragic 11.3% |
| Barbadians | 0.0 /100 | #285 | Tragic 11.3% |
Demographics Similar to Native Hawaiians by Family Poverty
In terms of family poverty, the demographic groups most similar to Native Hawaiians are Paraguayan (8.3%, a difference of 0.010%), Palestinian (8.3%, a difference of 0.080%), Immigrants from Egypt (8.3%, a difference of 0.17%), Soviet Union (8.3%, a difference of 0.18%), and Pakistani (8.3%, a difference of 0.22%).
| Demographics | Rating | Rank | Family Poverty |
| Immigrants | Zimbabwe | 94.0 /100 | #114 | Exceptional 8.2% |
| Immigrants | Israel | 93.5 /100 | #115 | Exceptional 8.2% |
| South Africans | 93.4 /100 | #116 | Exceptional 8.2% |
| Immigrants | Russia | 93.2 /100 | #117 | Exceptional 8.2% |
| Immigrants | Western Europe | 92.9 /100 | #118 | Exceptional 8.2% |
| French | 92.8 /100 | #119 | Exceptional 8.3% |
| Immigrants | Egypt | 91.6 /100 | #120 | Exceptional 8.3% |
| Native Hawaiians | 91.3 /100 | #121 | Exceptional 8.3% |
| Paraguayans | 91.2 /100 | #122 | Exceptional 8.3% |
| Palestinians | 91.1 /100 | #123 | Exceptional 8.3% |
| Soviet Union | 90.8 /100 | #124 | Exceptional 8.3% |
| Pakistanis | 90.8 /100 | #125 | Exceptional 8.3% |
| Icelanders | 90.3 /100 | #126 | Exceptional 8.3% |
| Immigrants | Hungary | 89.9 /100 | #127 | Excellent 8.4% |
| Argentineans | 89.6 /100 | #128 | Excellent 8.4% |