Welsh vs Immigrants from Guyana Female Poverty
COMPARE
Welsh
Immigrants from Guyana
Female Poverty
Female Poverty Comparison
Welsh
Immigrants from Guyana
12.7%
FEMALE POVERTY
91.6/ 100
METRIC RATING
114th/ 347
METRIC RANK
15.6%
FEMALE POVERTY
0.1/ 100
METRIC RATING
260th/ 347
METRIC RANK
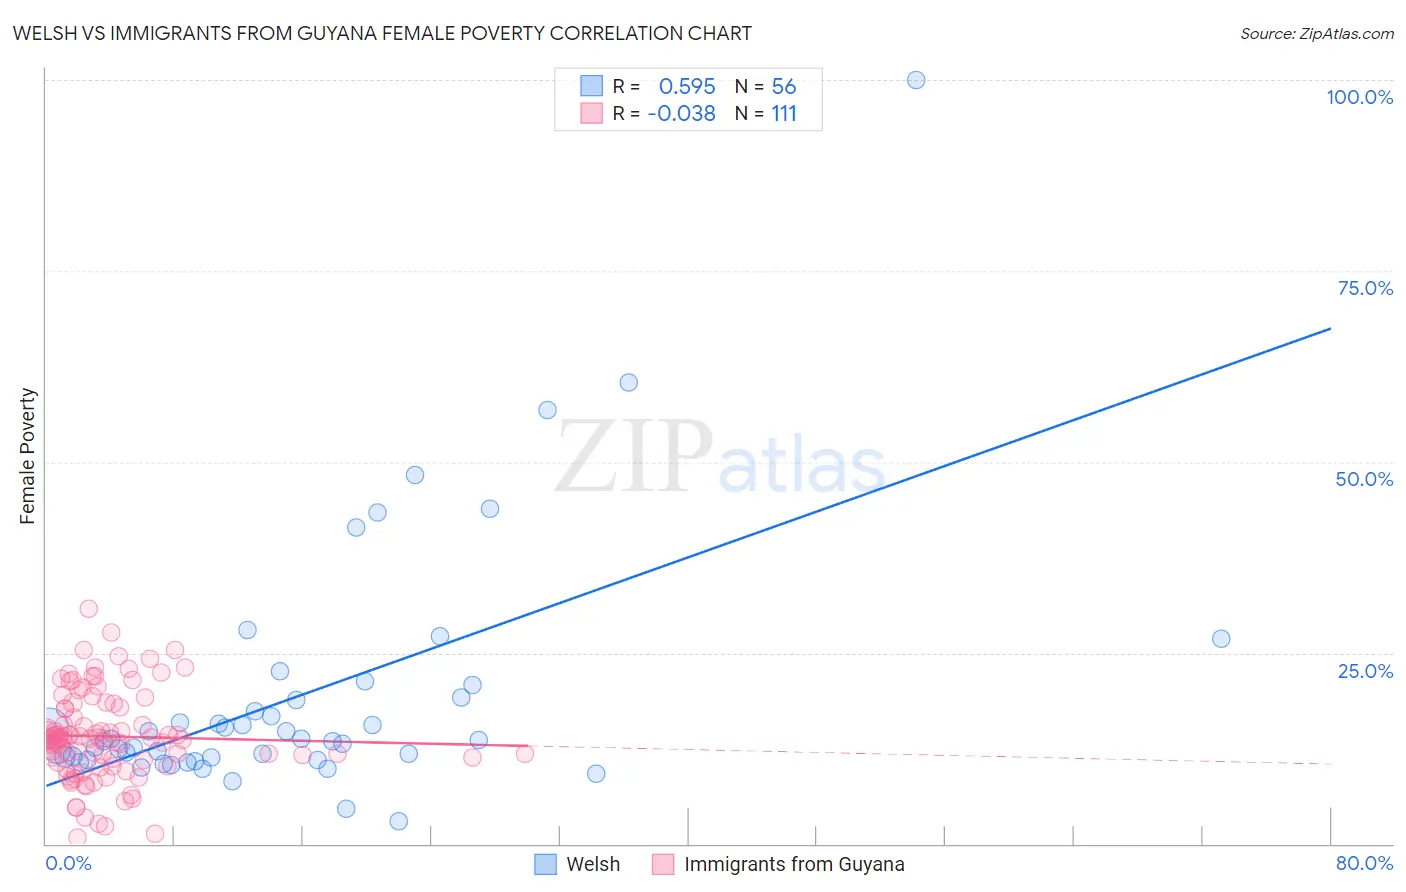
Welsh vs Immigrants from Guyana Female Poverty Correlation Chart
The statistical analysis conducted on geographies consisting of 527,858,131 people shows a substantial positive correlation between the proportion of Welsh and poverty level among females in the United States with a correlation coefficient (R) of 0.595 and weighted average of 12.7%. Similarly, the statistical analysis conducted on geographies consisting of 183,633,406 people shows no correlation between the proportion of Immigrants from Guyana and poverty level among females in the United States with a correlation coefficient (R) of -0.038 and weighted average of 15.6%, a difference of 23.1%.
Female Poverty Correlation Summary
| Measurement | Welsh | Immigrants from Guyana |
| Minimum | 3.0% | 0.82% |
| Maximum | 100.0% | 30.8% |
| Range | 97.0% | 30.0% |
| Mean | 19.2% | 14.1% |
| Median | 13.5% | 13.7% |
| Interquartile 25% (IQ1) | 11.1% | 10.9% |
| Interquartile 75% (IQ3) | 19.0% | 17.7% |
| Interquartile Range (IQR) | 7.9% | 6.8% |
| Standard Deviation (Sample) | 16.4% | 5.7% |
| Standard Deviation (Population) | 16.2% | 5.7% |
Similar Demographics by Female Poverty
Demographics Similar to Welsh by Female Poverty
In terms of female poverty, the demographic groups most similar to Welsh are Puget Sound Salish (12.7%, a difference of 0.020%), Canadian (12.7%, a difference of 0.12%), Immigrants from Russia (12.7%, a difference of 0.14%), Immigrants from Israel (12.6%, a difference of 0.15%), and Immigrants from Southern Europe (12.7%, a difference of 0.22%).
| Demographics | Rating | Rank | Female Poverty |
| Laotians | 93.4 /100 | #107 | Exceptional 12.6% |
| Portuguese | 93.1 /100 | #108 | Exceptional 12.6% |
| Immigrants | Zimbabwe | 93.1 /100 | #109 | Exceptional 12.6% |
| Paraguayans | 93.0 /100 | #110 | Exceptional 12.6% |
| Soviet Union | 92.4 /100 | #111 | Exceptional 12.6% |
| Immigrants | Israel | 92.0 /100 | #112 | Exceptional 12.6% |
| Canadians | 92.0 /100 | #113 | Exceptional 12.7% |
| Welsh | 91.6 /100 | #114 | Exceptional 12.7% |
| Puget Sound Salish | 91.5 /100 | #115 | Exceptional 12.7% |
| Immigrants | Russia | 91.2 /100 | #116 | Exceptional 12.7% |
| Immigrants | Southern Europe | 90.9 /100 | #117 | Exceptional 12.7% |
| Sri Lankans | 90.9 /100 | #118 | Exceptional 12.7% |
| Albanians | 90.8 /100 | #119 | Exceptional 12.7% |
| New Zealanders | 90.6 /100 | #120 | Exceptional 12.7% |
| Immigrants | Hungary | 90.3 /100 | #121 | Exceptional 12.7% |
Demographics Similar to Immigrants from Guyana by Female Poverty
In terms of female poverty, the demographic groups most similar to Immigrants from Guyana are Cape Verdean (15.6%, a difference of 0.080%), Guyanese (15.6%, a difference of 0.10%), Mexican American Indian (15.6%, a difference of 0.10%), Cherokee (15.6%, a difference of 0.11%), and Shoshone (15.6%, a difference of 0.19%).
| Demographics | Rating | Rank | Female Poverty |
| Liberians | 0.2 /100 | #253 | Tragic 15.4% |
| Trinidadians and Tobagonians | 0.2 /100 | #254 | Tragic 15.4% |
| Ottawa | 0.2 /100 | #255 | Tragic 15.5% |
| Jamaicans | 0.2 /100 | #256 | Tragic 15.5% |
| Immigrants | Jamaica | 0.1 /100 | #257 | Tragic 15.6% |
| Shoshone | 0.1 /100 | #258 | Tragic 15.6% |
| Cape Verdeans | 0.1 /100 | #259 | Tragic 15.6% |
| Immigrants | Guyana | 0.1 /100 | #260 | Tragic 15.6% |
| Guyanese | 0.1 /100 | #261 | Tragic 15.6% |
| Mexican American Indians | 0.1 /100 | #262 | Tragic 15.6% |
| Cherokee | 0.1 /100 | #263 | Tragic 15.6% |
| Immigrants | Ecuador | 0.1 /100 | #264 | Tragic 15.6% |
| Immigrants | Liberia | 0.1 /100 | #265 | Tragic 15.7% |
| Immigrants | El Salvador | 0.1 /100 | #266 | Tragic 15.7% |
| Sub-Saharan Africans | 0.1 /100 | #267 | Tragic 15.8% |