Welsh vs Immigrants from Kuwait Female Poverty
COMPARE
Welsh
Immigrants from Kuwait
Female Poverty
Female Poverty Comparison
Welsh
Immigrants from Kuwait
12.7%
FEMALE POVERTY
91.6/ 100
METRIC RATING
114th/ 347
METRIC RANK
13.7%
FEMALE POVERTY
32.7/ 100
METRIC RATING
191st/ 347
METRIC RANK
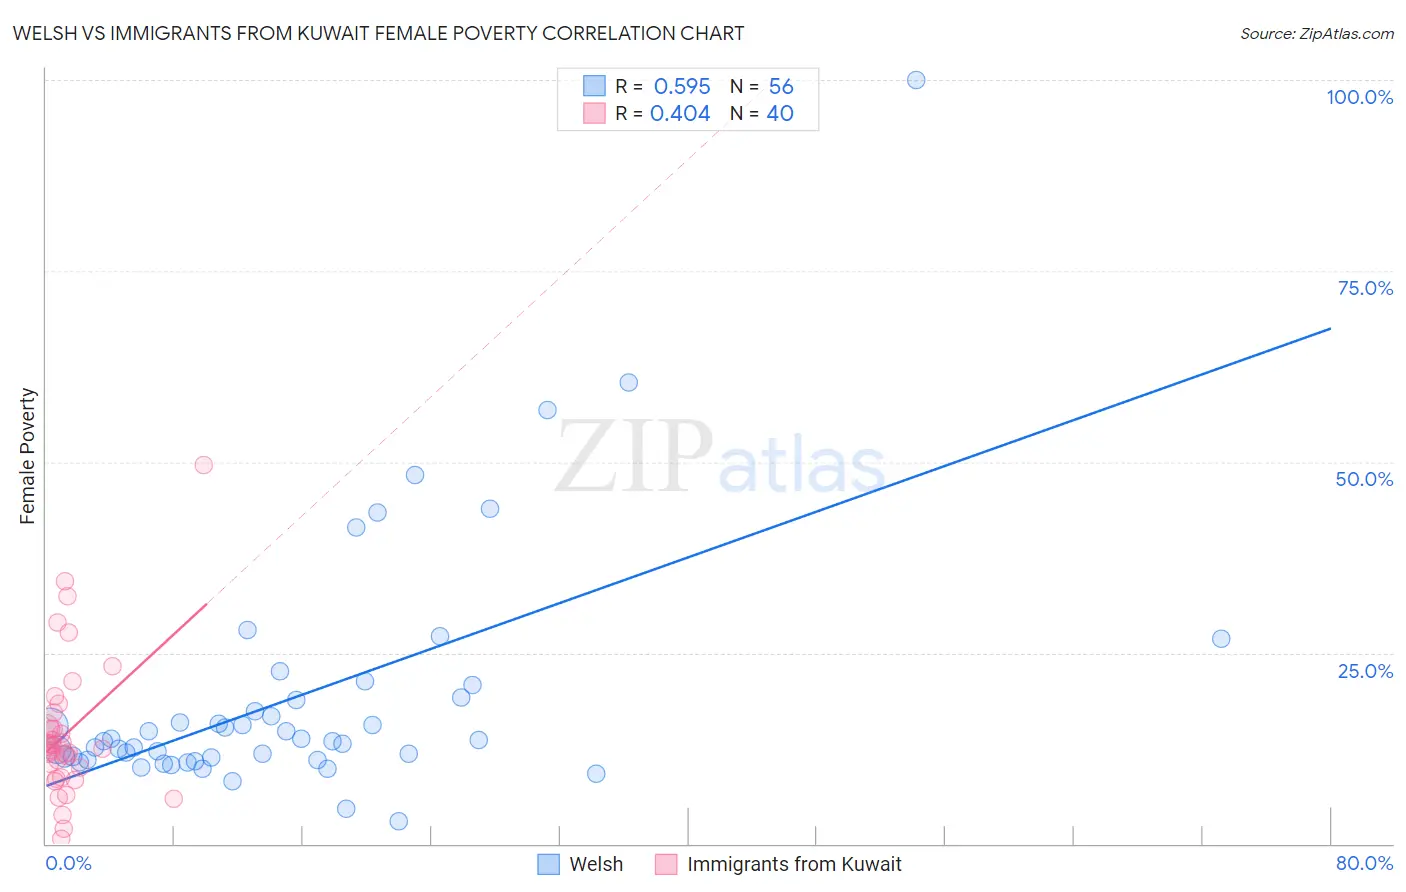
Welsh vs Immigrants from Kuwait Female Poverty Correlation Chart
The statistical analysis conducted on geographies consisting of 527,858,131 people shows a substantial positive correlation between the proportion of Welsh and poverty level among females in the United States with a correlation coefficient (R) of 0.595 and weighted average of 12.7%. Similarly, the statistical analysis conducted on geographies consisting of 136,883,256 people shows a moderate positive correlation between the proportion of Immigrants from Kuwait and poverty level among females in the United States with a correlation coefficient (R) of 0.404 and weighted average of 13.7%, a difference of 7.9%.
Female Poverty Correlation Summary
| Measurement | Welsh | Immigrants from Kuwait |
| Minimum | 3.0% | 0.62% |
| Maximum | 100.0% | 49.6% |
| Range | 97.0% | 49.0% |
| Mean | 19.2% | 14.6% |
| Median | 13.5% | 12.6% |
| Interquartile 25% (IQ1) | 11.1% | 9.3% |
| Interquartile 75% (IQ3) | 19.0% | 16.3% |
| Interquartile Range (IQR) | 7.9% | 7.0% |
| Standard Deviation (Sample) | 16.4% | 9.4% |
| Standard Deviation (Population) | 16.2% | 9.3% |
Similar Demographics by Female Poverty
Demographics Similar to Welsh by Female Poverty
In terms of female poverty, the demographic groups most similar to Welsh are Puget Sound Salish (12.7%, a difference of 0.020%), Canadian (12.7%, a difference of 0.12%), Immigrants from Russia (12.7%, a difference of 0.14%), Immigrants from Israel (12.6%, a difference of 0.15%), and Immigrants from Southern Europe (12.7%, a difference of 0.22%).
| Demographics | Rating | Rank | Female Poverty |
| Laotians | 93.4 /100 | #107 | Exceptional 12.6% |
| Portuguese | 93.1 /100 | #108 | Exceptional 12.6% |
| Immigrants | Zimbabwe | 93.1 /100 | #109 | Exceptional 12.6% |
| Paraguayans | 93.0 /100 | #110 | Exceptional 12.6% |
| Soviet Union | 92.4 /100 | #111 | Exceptional 12.6% |
| Immigrants | Israel | 92.0 /100 | #112 | Exceptional 12.6% |
| Canadians | 92.0 /100 | #113 | Exceptional 12.7% |
| Welsh | 91.6 /100 | #114 | Exceptional 12.7% |
| Puget Sound Salish | 91.5 /100 | #115 | Exceptional 12.7% |
| Immigrants | Russia | 91.2 /100 | #116 | Exceptional 12.7% |
| Immigrants | Southern Europe | 90.9 /100 | #117 | Exceptional 12.7% |
| Sri Lankans | 90.9 /100 | #118 | Exceptional 12.7% |
| Albanians | 90.8 /100 | #119 | Exceptional 12.7% |
| New Zealanders | 90.6 /100 | #120 | Exceptional 12.7% |
| Immigrants | Hungary | 90.3 /100 | #121 | Exceptional 12.7% |
Demographics Similar to Immigrants from Kuwait by Female Poverty
In terms of female poverty, the demographic groups most similar to Immigrants from Kuwait are Sierra Leonean (13.7%, a difference of 0.040%), Immigrants from Costa Rica (13.7%, a difference of 0.090%), Iraqi (13.7%, a difference of 0.10%), Delaware (13.7%, a difference of 0.17%), and Immigrants from South America (13.7%, a difference of 0.23%).
| Demographics | Rating | Rank | Female Poverty |
| Immigrants | Sierra Leone | 43.2 /100 | #184 | Average 13.5% |
| Immigrants | Cameroon | 42.0 /100 | #185 | Average 13.5% |
| Immigrants | Portugal | 41.5 /100 | #186 | Average 13.6% |
| Immigrants | Venezuela | 41.0 /100 | #187 | Average 13.6% |
| Hawaiians | 39.9 /100 | #188 | Fair 13.6% |
| Uruguayans | 39.8 /100 | #189 | Fair 13.6% |
| Sierra Leoneans | 33.1 /100 | #190 | Fair 13.7% |
| Immigrants | Kuwait | 32.7 /100 | #191 | Fair 13.7% |
| Immigrants | Costa Rica | 31.9 /100 | #192 | Fair 13.7% |
| Iraqis | 31.8 /100 | #193 | Fair 13.7% |
| Delaware | 31.1 /100 | #194 | Fair 13.7% |
| Immigrants | South America | 30.6 /100 | #195 | Fair 13.7% |
| South American Indians | 28.9 /100 | #196 | Fair 13.7% |
| Arabs | 28.6 /100 | #197 | Fair 13.7% |
| Immigrants | Uganda | 28.5 /100 | #198 | Fair 13.7% |