French Canadian vs Immigrants from Guyana Female Poverty
COMPARE
French Canadian
Immigrants from Guyana
Female Poverty
Female Poverty Comparison
French Canadians
Immigrants from Guyana
12.7%
FEMALE POVERTY
90.2/ 100
METRIC RATING
122nd/ 347
METRIC RANK
15.6%
FEMALE POVERTY
0.1/ 100
METRIC RATING
260th/ 347
METRIC RANK
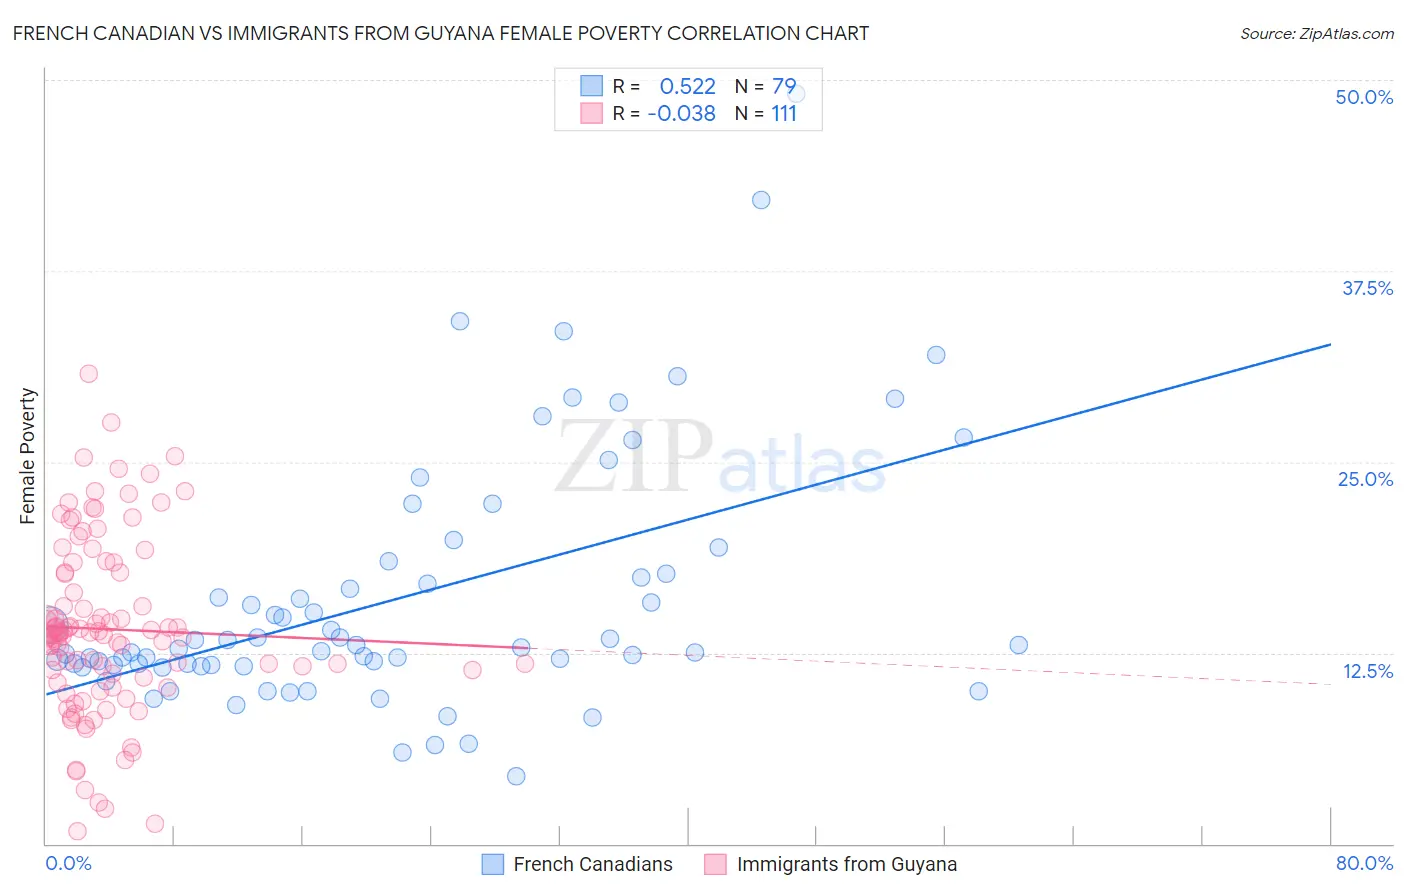
French Canadian vs Immigrants from Guyana Female Poverty Correlation Chart
The statistical analysis conducted on geographies consisting of 502,012,927 people shows a substantial positive correlation between the proportion of French Canadians and poverty level among females in the United States with a correlation coefficient (R) of 0.522 and weighted average of 12.7%. Similarly, the statistical analysis conducted on geographies consisting of 183,633,406 people shows no correlation between the proportion of Immigrants from Guyana and poverty level among females in the United States with a correlation coefficient (R) of -0.038 and weighted average of 15.6%, a difference of 22.5%.
Female Poverty Correlation Summary
| Measurement | French Canadian | Immigrants from Guyana |
| Minimum | 4.4% | 0.82% |
| Maximum | 49.1% | 30.8% |
| Range | 44.7% | 30.0% |
| Mean | 16.1% | 14.1% |
| Median | 12.8% | 13.7% |
| Interquartile 25% (IQ1) | 11.7% | 10.9% |
| Interquartile 75% (IQ3) | 17.6% | 17.7% |
| Interquartile Range (IQR) | 6.0% | 6.8% |
| Standard Deviation (Sample) | 8.3% | 5.7% |
| Standard Deviation (Population) | 8.2% | 5.7% |
Similar Demographics by Female Poverty
Demographics Similar to French Canadians by Female Poverty
In terms of female poverty, the demographic groups most similar to French Canadians are Immigrants from Hungary (12.7%, a difference of 0.040%), Immigrants from South Eastern Asia (12.7%, a difference of 0.070%), New Zealander (12.7%, a difference of 0.14%), Albanian (12.7%, a difference of 0.20%), and Sri Lankan (12.7%, a difference of 0.21%).
| Demographics | Rating | Rank | Female Poverty |
| Puget Sound Salish | 91.5 /100 | #115 | Exceptional 12.7% |
| Immigrants | Russia | 91.2 /100 | #116 | Exceptional 12.7% |
| Immigrants | Southern Europe | 90.9 /100 | #117 | Exceptional 12.7% |
| Sri Lankans | 90.9 /100 | #118 | Exceptional 12.7% |
| Albanians | 90.8 /100 | #119 | Exceptional 12.7% |
| New Zealanders | 90.6 /100 | #120 | Exceptional 12.7% |
| Immigrants | Hungary | 90.3 /100 | #121 | Exceptional 12.7% |
| French Canadians | 90.2 /100 | #122 | Exceptional 12.7% |
| Immigrants | South Eastern Asia | 89.9 /100 | #123 | Excellent 12.7% |
| Immigrants | Norway | 89.3 /100 | #124 | Excellent 12.8% |
| Argentineans | 89.1 /100 | #125 | Excellent 12.8% |
| Immigrants | Ukraine | 88.8 /100 | #126 | Excellent 12.8% |
| South Africans | 88.4 /100 | #127 | Excellent 12.8% |
| Immigrants | Belarus | 88.2 /100 | #128 | Excellent 12.8% |
| Immigrants | Brazil | 87.9 /100 | #129 | Excellent 12.8% |
Demographics Similar to Immigrants from Guyana by Female Poverty
In terms of female poverty, the demographic groups most similar to Immigrants from Guyana are Cape Verdean (15.6%, a difference of 0.080%), Guyanese (15.6%, a difference of 0.10%), Mexican American Indian (15.6%, a difference of 0.10%), Cherokee (15.6%, a difference of 0.11%), and Shoshone (15.6%, a difference of 0.19%).
| Demographics | Rating | Rank | Female Poverty |
| Liberians | 0.2 /100 | #253 | Tragic 15.4% |
| Trinidadians and Tobagonians | 0.2 /100 | #254 | Tragic 15.4% |
| Ottawa | 0.2 /100 | #255 | Tragic 15.5% |
| Jamaicans | 0.2 /100 | #256 | Tragic 15.5% |
| Immigrants | Jamaica | 0.1 /100 | #257 | Tragic 15.6% |
| Shoshone | 0.1 /100 | #258 | Tragic 15.6% |
| Cape Verdeans | 0.1 /100 | #259 | Tragic 15.6% |
| Immigrants | Guyana | 0.1 /100 | #260 | Tragic 15.6% |
| Guyanese | 0.1 /100 | #261 | Tragic 15.6% |
| Mexican American Indians | 0.1 /100 | #262 | Tragic 15.6% |
| Cherokee | 0.1 /100 | #263 | Tragic 15.6% |
| Immigrants | Ecuador | 0.1 /100 | #264 | Tragic 15.6% |
| Immigrants | Liberia | 0.1 /100 | #265 | Tragic 15.7% |
| Immigrants | El Salvador | 0.1 /100 | #266 | Tragic 15.7% |
| Sub-Saharan Africans | 0.1 /100 | #267 | Tragic 15.8% |