Welsh vs Immigrants from Guyana Associate's Degree
COMPARE
Welsh
Immigrants from Guyana
Associate's Degree
Associate's Degree Comparison
Welsh
Immigrants from Guyana
45.9%
ASSOCIATE'S DEGREE
37.9/ 100
METRIC RATING
186th/ 347
METRIC RANK
41.8%
ASSOCIATE'S DEGREE
0.5/ 100
METRIC RATING
255th/ 347
METRIC RANK
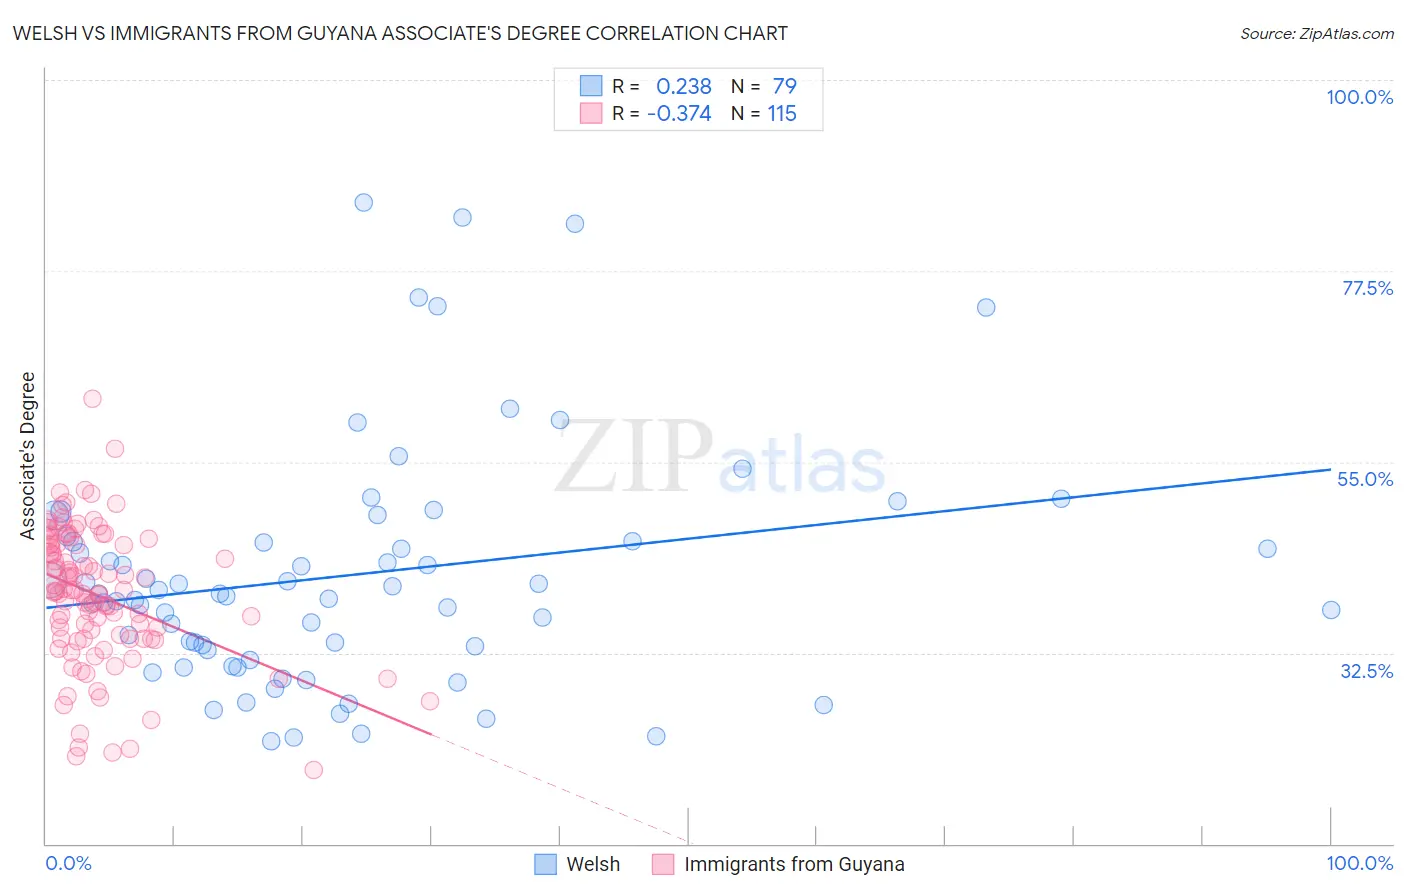
Welsh vs Immigrants from Guyana Associate's Degree Correlation Chart
The statistical analysis conducted on geographies consisting of 528,554,894 people shows a weak positive correlation between the proportion of Welsh and percentage of population with at least associate's degree education in the United States with a correlation coefficient (R) of 0.238 and weighted average of 45.9%. Similarly, the statistical analysis conducted on geographies consisting of 183,738,689 people shows a mild negative correlation between the proportion of Immigrants from Guyana and percentage of population with at least associate's degree education in the United States with a correlation coefficient (R) of -0.374 and weighted average of 41.8%, a difference of 9.8%.
Associate's Degree Correlation Summary
| Measurement | Welsh | Immigrants from Guyana |
| Minimum | 22.1% | 18.6% |
| Maximum | 85.6% | 62.4% |
| Range | 63.5% | 43.8% |
| Mean | 41.7% | 39.3% |
| Median | 39.4% | 39.7% |
| Interquartile 25% (IQ1) | 32.9% | 34.1% |
| Interquartile 75% (IQ3) | 45.7% | 45.3% |
| Interquartile Range (IQR) | 12.8% | 11.2% |
| Standard Deviation (Sample) | 14.0% | 8.0% |
| Standard Deviation (Population) | 13.9% | 8.0% |
Similar Demographics by Associate's Degree
Demographics Similar to Welsh by Associate's Degree
In terms of associate's degree, the demographic groups most similar to Welsh are Costa Rican (46.0%, a difference of 0.060%), Czechoslovakian (46.0%, a difference of 0.17%), Yugoslavian (46.0%, a difference of 0.19%), Swiss (46.0%, a difference of 0.20%), and Immigrants from Uruguay (45.8%, a difference of 0.20%).
| Demographics | Rating | Rank | Associate's Degree |
| Sri Lankans | 47.6 /100 | #179 | Average 46.3% |
| Bermudans | 46.4 /100 | #180 | Average 46.2% |
| Immigrants | Colombia | 41.3 /100 | #181 | Average 46.0% |
| Swiss | 40.4 /100 | #182 | Average 46.0% |
| Yugoslavians | 40.2 /100 | #183 | Average 46.0% |
| Czechoslovakians | 40.0 /100 | #184 | Average 46.0% |
| Costa Ricans | 38.6 /100 | #185 | Fair 46.0% |
| Welsh | 37.9 /100 | #186 | Fair 45.9% |
| Immigrants | Uruguay | 35.5 /100 | #187 | Fair 45.8% |
| Ghanaians | 35.5 /100 | #188 | Fair 45.8% |
| Immigrants | Oceania | 34.7 /100 | #189 | Fair 45.8% |
| Vietnamese | 34.0 /100 | #190 | Fair 45.8% |
| Koreans | 33.8 /100 | #191 | Fair 45.8% |
| Celtics | 33.3 /100 | #192 | Fair 45.8% |
| Immigrants | Cameroon | 31.0 /100 | #193 | Fair 45.7% |
Demographics Similar to Immigrants from Guyana by Associate's Degree
In terms of associate's degree, the demographic groups most similar to Immigrants from Guyana are Cuban (41.9%, a difference of 0.090%), Immigrants from Congo (41.8%, a difference of 0.12%), Indonesian (41.9%, a difference of 0.15%), Spanish American (41.8%, a difference of 0.18%), and French American Indian (42.0%, a difference of 0.25%).
| Demographics | Rating | Rank | Associate's Degree |
| Immigrants | Ecuador | 0.8 /100 | #248 | Tragic 42.2% |
| Jamaicans | 0.7 /100 | #249 | Tragic 42.1% |
| U.S. Virgin Islanders | 0.7 /100 | #250 | Tragic 42.1% |
| Immigrants | Bahamas | 0.7 /100 | #251 | Tragic 42.1% |
| French American Indians | 0.6 /100 | #252 | Tragic 42.0% |
| Indonesians | 0.6 /100 | #253 | Tragic 41.9% |
| Cubans | 0.6 /100 | #254 | Tragic 41.9% |
| Immigrants | Guyana | 0.5 /100 | #255 | Tragic 41.8% |
| Immigrants | Congo | 0.5 /100 | #256 | Tragic 41.8% |
| Spanish Americans | 0.5 /100 | #257 | Tragic 41.8% |
| Japanese | 0.5 /100 | #258 | Tragic 41.7% |
| Malaysians | 0.4 /100 | #259 | Tragic 41.6% |
| Marshallese | 0.4 /100 | #260 | Tragic 41.6% |
| Nicaraguans | 0.4 /100 | #261 | Tragic 41.5% |
| Bahamians | 0.4 /100 | #262 | Tragic 41.5% |