Welsh vs Black/African American Female Poverty
COMPARE
Welsh
Black/African American
Female Poverty
Female Poverty Comparison
Welsh
Blacks/African Americans
12.7%
FEMALE POVERTY
91.6/ 100
METRIC RATING
114th/ 347
METRIC RANK
18.6%
FEMALE POVERTY
0.0/ 100
METRIC RATING
328th/ 347
METRIC RANK
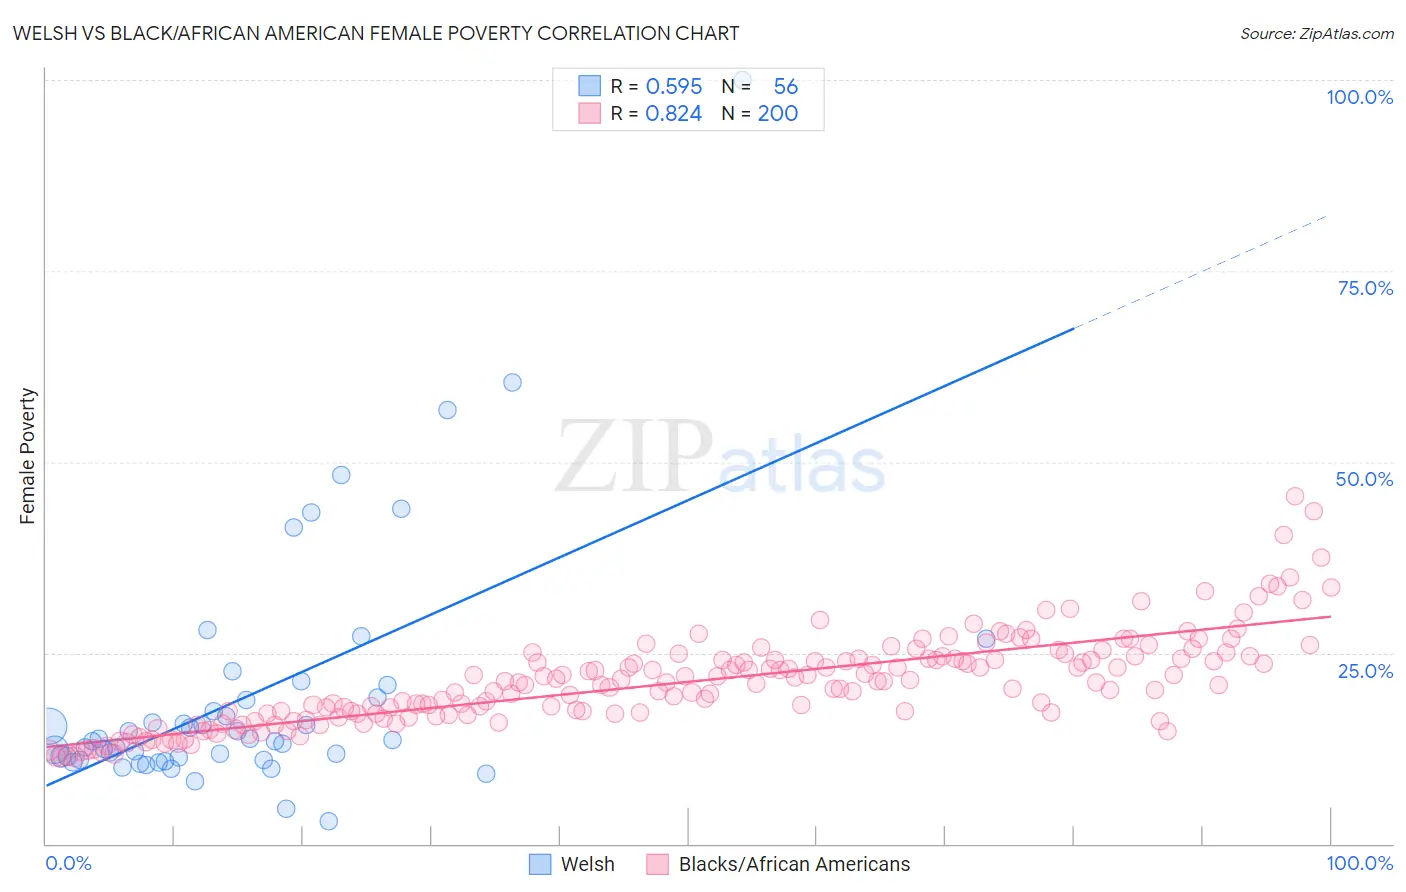
Welsh vs Black/African American Female Poverty Correlation Chart
The statistical analysis conducted on geographies consisting of 527,858,131 people shows a substantial positive correlation between the proportion of Welsh and poverty level among females in the United States with a correlation coefficient (R) of 0.595 and weighted average of 12.7%. Similarly, the statistical analysis conducted on geographies consisting of 564,914,608 people shows a very strong positive correlation between the proportion of Blacks/African Americans and poverty level among females in the United States with a correlation coefficient (R) of 0.824 and weighted average of 18.6%, a difference of 46.7%.
Female Poverty Correlation Summary
| Measurement | Welsh | Black/African American |
| Minimum | 3.0% | 11.4% |
| Maximum | 100.0% | 45.5% |
| Range | 97.0% | 34.1% |
| Mean | 19.2% | 21.2% |
| Median | 13.5% | 21.0% |
| Interquartile 25% (IQ1) | 11.1% | 16.9% |
| Interquartile 75% (IQ3) | 19.0% | 24.2% |
| Interquartile Range (IQR) | 7.9% | 7.3% |
| Standard Deviation (Sample) | 16.4% | 6.0% |
| Standard Deviation (Population) | 16.2% | 6.0% |
Similar Demographics by Female Poverty
Demographics Similar to Welsh by Female Poverty
In terms of female poverty, the demographic groups most similar to Welsh are Puget Sound Salish (12.7%, a difference of 0.020%), Canadian (12.7%, a difference of 0.12%), Immigrants from Russia (12.7%, a difference of 0.14%), Immigrants from Israel (12.6%, a difference of 0.15%), and Immigrants from Southern Europe (12.7%, a difference of 0.22%).
| Demographics | Rating | Rank | Female Poverty |
| Laotians | 93.4 /100 | #107 | Exceptional 12.6% |
| Portuguese | 93.1 /100 | #108 | Exceptional 12.6% |
| Immigrants | Zimbabwe | 93.1 /100 | #109 | Exceptional 12.6% |
| Paraguayans | 93.0 /100 | #110 | Exceptional 12.6% |
| Soviet Union | 92.4 /100 | #111 | Exceptional 12.6% |
| Immigrants | Israel | 92.0 /100 | #112 | Exceptional 12.6% |
| Canadians | 92.0 /100 | #113 | Exceptional 12.7% |
| Welsh | 91.6 /100 | #114 | Exceptional 12.7% |
| Puget Sound Salish | 91.5 /100 | #115 | Exceptional 12.7% |
| Immigrants | Russia | 91.2 /100 | #116 | Exceptional 12.7% |
| Immigrants | Southern Europe | 90.9 /100 | #117 | Exceptional 12.7% |
| Sri Lankans | 90.9 /100 | #118 | Exceptional 12.7% |
| Albanians | 90.8 /100 | #119 | Exceptional 12.7% |
| New Zealanders | 90.6 /100 | #120 | Exceptional 12.7% |
| Immigrants | Hungary | 90.3 /100 | #121 | Exceptional 12.7% |
Demographics Similar to Blacks/African Americans by Female Poverty
In terms of female poverty, the demographic groups most similar to Blacks/African Americans are Kiowa (18.6%, a difference of 0.12%), Dominican (19.1%, a difference of 2.9%), Yakama (18.0%, a difference of 3.0%), Central American Indian (18.0%, a difference of 3.1%), and Native/Alaskan (19.2%, a difference of 3.3%).
| Demographics | Rating | Rank | Female Poverty |
| Arapaho | 0.0 /100 | #321 | Tragic 17.5% |
| Menominee | 0.0 /100 | #322 | Tragic 17.6% |
| Paiute | 0.0 /100 | #323 | Tragic 17.7% |
| Immigrants | Honduras | 0.0 /100 | #324 | Tragic 17.7% |
| Colville | 0.0 /100 | #325 | Tragic 17.8% |
| Central American Indians | 0.0 /100 | #326 | Tragic 18.0% |
| Yakama | 0.0 /100 | #327 | Tragic 18.0% |
| Blacks/African Americans | 0.0 /100 | #328 | Tragic 18.6% |
| Kiowa | 0.0 /100 | #329 | Tragic 18.6% |
| Dominicans | 0.0 /100 | #330 | Tragic 19.1% |
| Natives/Alaskans | 0.0 /100 | #331 | Tragic 19.2% |
| Apache | 0.0 /100 | #332 | Tragic 19.2% |
| Immigrants | Dominican Republic | 0.0 /100 | #333 | Tragic 19.3% |
| Houma | 0.0 /100 | #334 | Tragic 20.0% |
| Cheyenne | 0.0 /100 | #335 | Tragic 20.2% |